Reduce Vacancy Risk Through Smarter Marketing
The Real Cost of Empty Units
Vacancy is not just lost rent. It is a compounding drain on NOI that you will never recover. Every empty day costs you revenue plus the operational friction of showings, utilities you are covering, vendor scheduling, and time spent chasing leads that never convert.
Nationally, the U.S. rental vacancy rate has been hovering in the mid to upper single digits in recent quarters. That is a meaningful headwind if you are self-managing and competing against professionally marketed inventory. And the market shifts fast. Supply, seasonality, affordability pressures, and renter behavior change constantly, which means "list it when it is empty" is no longer a safe plan.
Here is the good news. Vacancy is one of the most controllable levers you have, if you treat marketing like an ongoing pipeline instead of a last-minute scramble. The same modern tactics that improve lead volume and lead quality (broad listing distribution, strong creative, rapid response, and automated follow-up) also shorten days vacant and reduce the risk of a stale listing that sits while you keep dropping price.
Consider what renters actually do today. They shop online first, compare options quickly, and expect fast answers. Large rental networks now reach massive audiences. Zillow reports 30 million renters monthly in 2024, and Apartments.com reports roughly 44 million monthly unique visitors. If your unit is not consistently visible, or your response speed is slow, your vacancy is effectively self-inflicted.
How marketing drives vacancy outcomes in practice:
- A well-distributed listing reaches renters where they already search, which can reduce dead time waiting for inquiries.
- Listings with 3D tours can generate dramatically more leads. Apartments.com cites 23 times more leads for listings with 3D tours.
- Better media changes the speed-to-lease curve. Zillow has reported 3D Home tours get 68% more views and homes sell about 10% faster (sales data, but the visibility and decision-speed effect translates to rentals).
Two takeaways:
- Start measuring vacancy like a pipeline problem, not a maintenance problem.
- Your marketing system should begin before notice is given, accelerate during the turn, and continue after lease signing to support retention.
Continuous Marketing Reduces Vacancy
Reducing vacancy through marketing is a simple idea with disciplined execution. Keep future availability visible. Attract the right prospects. Respond quickly. Retain good tenants so you do not have to re-fill as often.
For independent landlords and property managers, the most reliable approach is continuous rental marketing. An always-on process that builds demand even when you do not have an immediate opening. That does not mean spamming ads year-round. It means maintaining a clean digital presence, publishing predictable future-availability signals, and using automation so you are not doing everything manually.
This guide provides a step-by-step workflow connecting modern tactics directly to vacancy reduction, including:
- Listing visibility across the places renters actually search
- Creative optimization (headlines, photo count, descriptions, 3D tours, video) that increases clicks and qualified inquiries
- Operational speed (fast follow-up, scheduling, central inbox messaging) to prevent lead decay
- Proactive renewal outreach and lease end management that reduces turnover, supported by predictive signals
- Reputation and transparency that improve conversion, especially when renters compare similar listings
Throughout, you will see concrete examples, mini case studies, and checklists you can run with a small team or solo. The unifying theme is leverage. The smartest systems reduce vacancy by doing three things at once:
- Increasing the number of qualified leads (volume)
- Shortening the time from inquiry to showing to application to approval (speed)
- Reducing the number of times you must re-market (retention)
Examples of always-on visibility that reduces vacancy risk:
- Keeping a "next available" or waitlist signal alongside your listings, even when full, so you can pre-fill a pipeline
- Publishing simple neighborhood content to support SEO and long-tail search discovery
- Maintaining consistent listing quality and media standards so every unit launches market-ready on day one
Two takeaways:
- Do not judge marketing by likes or even inquiries alone. Judge it by days vacant and lead-to-lease cycle time.
- Those are the metrics that hit NOI.
Step-by-Step Workflow to Reduce Vacancy
Step 1: Treat Vacancy Like a Funnel and Track the Right Metrics
Most vacancy mysteries are measurement problems. If you only track whether the unit is vacant, you miss the leading indicators that tell you why it is vacant. Low views, low inquiry rate, slow response, poor showing-to-application conversion, or weak renewal rates.
Start with a basic funnel and attach targets:
- Impressions and views (are people seeing it?)
- Inquiries (is the listing compelling?)
- Showings scheduled (is your response fast and the process easy?)
- Applications started and completed (is screening friction too high or unclear?)
- Approved and deposit paid (are you losing prospects to faster operators?)
Use listing network reach as context. If a platform reaches tens of millions of renters monthly, your performance depends on your listing competitiveness and speed, not "market demand" alone. Also pay attention to seasonality. Zillow notes renter activity spikes during peak months, like early summer, which affects lead volume and how early you should launch listings. When you know your seasonal curve, you can adjust launch timing and pricing proactively.
Mini case study #1
Sarah, a 12-door landlord, realized her units were not hard to rent. Her workflow was slow. She began tracking response time and showing conversion. By switching to a simple funnel dashboard and setting a rule that every inquiry gets a reply within one business hour, she reduced her average vacancy by 18 days over two turns. The biggest change was not price. It was speed plus clearer screening criteria upfront.
Examples of funnel-based fixes
- Lots of views but few inquiries: headline, photos, or price positioning issue.
- Lots of inquiries but few showings: slow response or scheduling friction.
- Lots of showings but few applications: mismatch between ad promise and reality. Improve accuracy and transparency.
Two takeaways:
- Set two non-negotiable service-level targets: inquiry response time and time from completed application to decision.
- Faster decisions reduce vacancy more reliably than small rent discounts.
Step 2: Build a Market Position Renters Can Understand in 10 Seconds
Renters do not buy your unit. They buy the story. Location, lifestyle, reliability, and clarity. Your brand as a small operator is often your advantage. Responsive service, clean units, transparent requirements, and a frictionless process. Make that positioning explicit in every listing and in your digital touchpoints.
Start with a simple positioning statement:
- "Updated, well-maintained homes with fast maintenance response and clear screening criteria."
- "Quiet buildings, professional communication, and easy online rent and repairs."
Then translate it into your listing content standards:
- Headline formula: start with price, then beds and baths, then an irresistible feature.
- Description structure: upgrades, amenities, requirements, and neighborhood highlights.
- Transparency: list key requirements clearly (income multiple, credit minimum if used, pet policy, fees) to reduce unqualified inquiries and speed approvals.
Examples of positioning that reduces vacancy
- Instead of "Nice 2BR," use: "$1,895 | 2BR/1BA | In-unit laundry + off-street parking" (price + basics + differentiator).
- Add a "What it is like to live here" section: noise level, parking reality, commute options.
- Include a "How to apply" block with steps and expected decision timeline.
Mini case study #2
A property manager overseeing 48 units standardized headlines and added a "Lease timeline" section to every ad. Inquiries became more qualified, and showing cancellations dropped. The team reported fewer back-and-forth questions because requirements were clearer upfront, creating a measurable drop in days vacant during winter leasing, when demand is typically softer.
Two takeaways:
- Positioning is not decoration. Clear, consistent messaging reduces vacancy by filtering out mismatches early.
- It also increases confidence for qualified renters to apply quickly.
Step 3: Win the Listing Page With Media: Photos, 3D Tours, and Video
Renters decide whether to inquire in seconds. Your media does the heavy lifting. The research is clear: interactive media increases engagement and lead volume. Apartments.com reports listings with 3D tours get 23 times more leads than those without. Zillow has also reported that 3D Home tours earn 68% more views and homes sell faster (sales-focused, but it signals how strongly tours influence decision-making).
Photo standards matter too. Zillow's guidance suggests an ideal range of 22 to 27 photos for stronger listing performance. In practical terms, this prevents the two common failure modes:
- Too few photos: renter uncertainty leads to fewer inquiries.
- Too many low-quality photos: clutter and distrust.
Photo best practices (operationally realistic)
- Shoot in daylight, lights on, blinds open.
- Lead with the hero image (bright living room or exterior).
- Include context shots: kitchen flow, storage, parking, entryway.
- Avoid misleading angles. Renters punish surprises with no-shows.
Examples of media upgrades that reduce vacancy
- Add a simple 3D tour for every turn. Use it to pre-qualify prospects who have not physically visited yet.
- Record a 60 to 90-second walkthrough video that matches the actual layout and calls out key features.
- Re-order photos so the first five images tell the full story.
Two takeaways:
- If you can only do one upgrade, do a 3D tour.
- The lead lift can offset the cost quickly because vacancy days are often more expensive than media.
Step 4: Publish Where Renters Search and Keep Future Availability Visible
A great listing that no one sees is still a vacancy. Wide listing distribution is the simplest way to expand exposure without multiplying your workload. The key is to use a workflow that pushes one high-quality listing to multiple networks and keeps it updated.
Zillow's rentals network reach (30 million renters monthly) shows how big the funnel is when you publish where renters actually browse. Apartments.com's network traffic is also massive at roughly 44 million monthly unique visitors. You do not need more marketing ideas as much as you need consistent distribution.
Distribution also supports continuous rental marketing. Even when you are fully occupied, you can:
- Maintain a "coming soon" cadence based on known lease-end dates, with tenant consent and fair housing compliance.
- Capture leads for future rental availability through a waitlist.
- Re-market your brand reputation so the next vacancy fills faster.
Practical distribution rules
- One canonical listing source (your site or platform) plus consistent data fields.
- Refresh listing content when it has been live 7 to 10 days without traction (new lead photo, tighten headline, add tour).
- Post timing: guidance often suggests midweek posting performs well (Tuesday through Thursday).
Examples
- A duplex operator publishes a single high-quality listing pushed to major portals. Inquiries double compared with single-site posting.
- A manager keeps "coming soon in 30 to 45 days" listings ready to activate immediately after notice, reducing downtime between turns.
- A portfolio adds a "join our next-available list" link in every listing description to keep a warm pipeline.
Two takeaways:
- Distribution reduces vacancy only when your data stays current.
- Use software and workflows that prevent outdated availability, incorrect pricing, or missing media. Those errors directly increase days vacant.
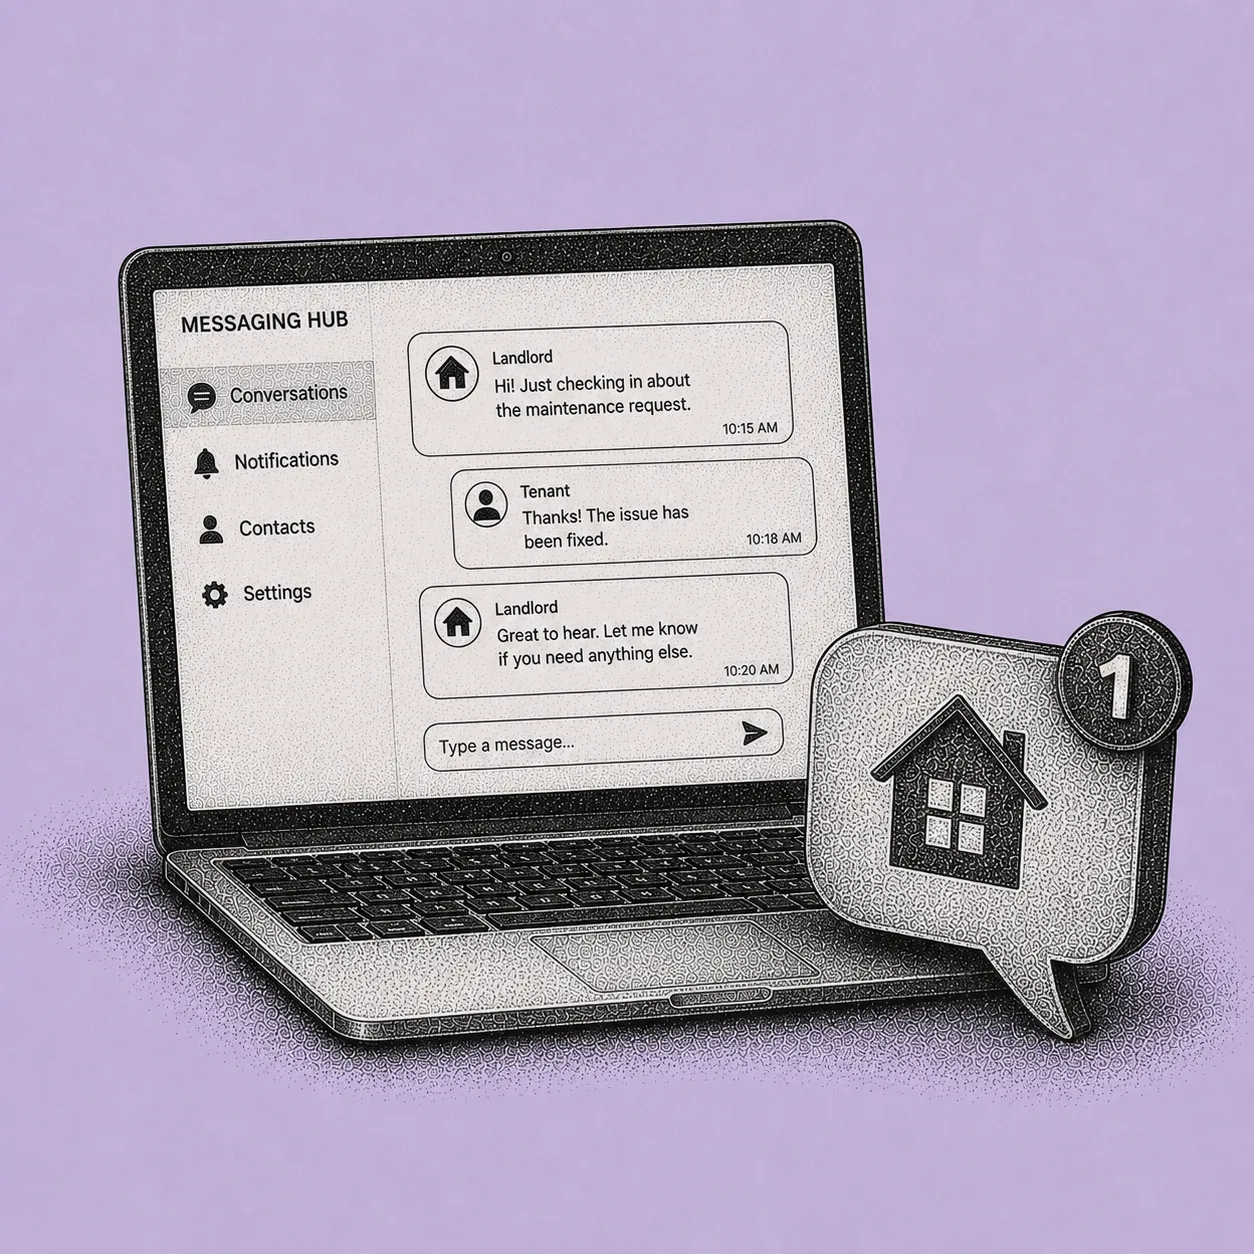
Step 5: Respond Faster With a Centralized Messaging Mindset (SMS, Email, Automation)
Speed is a vacancy strategy. Online leads decay quickly. If you respond hours later, many prospects have already booked another showing. This is where a centralized messaging approach (one inbox, templates, automation, and logging) outperforms scattered texts, personal email, and missed calls.
Build a simple communication stack
- Auto-reply confirming receipt and next step ("Answer these 3 questions to schedule").
- Templates for FAQs (pet policy, income requirements, move-in costs, showing windows).
- Follow-up drip for non-responsive leads (email or SMS).
- Central log for compliance and continuity.
Also, keep the process digitally complete. Online scheduling, online applications, and clear screening steps. This pairs naturally with lease management software because the same platform can carry the renter from inquiry to application to lease signing without handoffs.
Examples of vacancy-reducing automations
- Showing confirmation and day-of reminder texts reduce no-shows.
- A 3-message drip over 72 hours for leads who inquired but did not schedule.
- An application nudge ("You are 70% complete. Upload pay stubs here.") to increase completion rate.
Two takeaways:
- Create two response templates today: first reply to inquiry, and showing invitation with screening pre-questions.
- If you do nothing else, you will reduce lost leads and shorten time-to-lease.
Step 6: Proactive Renewals and Lease End Management
The cheapest vacancy is the one you never create. Retention is marketing because it preserves occupancy without re-acquisition costs. Yet many small operators treat renewals as an administrative afterthought. Modern practice is lease end management: proactive outreach, clear options, and early identification of likely move-outs.
Start renewal work 90 to 120 days before lease end
- Confirm tenant intent (renew, month-to-month, or vacate).
- Share renewal offer with deadline and clear rent terms.
- Offer easy digital acceptance and e-signature.
- If they are likely to leave, start pre-marketing future availability and line up vendors.
Emerging tools add predictive signals to this process: late payments, maintenance volume changes, communication sentiment, prior renewal behavior. Even simple rules in a spreadsheet help. If a tenant has asked about move-out procedures, requested multiple repairs, or had repeated payment friction, treat that lease as at-risk and start earlier.
Examples of renewal outreach that reduces vacancy
- Offer a renewal with a clear "good, better, best" term menu (12 months, 18 months, 24 months).
- Send a "renewal preview" 120 days out so tenants can budget.
- If non-renewal is likely, schedule pre-move-out inspections early and pre-book cleaners and paint.
Two takeaways:
- Put renewal touches on a calendar or automate them.
- A consistent renewal cadence can reduce vacancy more than any single advertising tactic because it reduces turnover volume.
Step 7: Reputation and Transparency Convert More of the Leads You Already Have
When renters compare similar units, trust wins. Renters read reviews, ask friends, and judge your responsiveness during the inquiry stage. You cannot ad-spend your way out of low trust. You need a system for transparency: collecting honest feedback, responding professionally, and ensuring your listings match reality.
Digital leasing trends indicate renters value a modern, transparent process. That transparency shows up in:
- Accurate photos with no bait-and-switch.
- Clear fees and requirements.
- Professional messaging and documented follow-through (maintenance updates, deposit accounting).
Examples of reputation actions that reduce vacancy
- After a successful maintenance resolution, ask for a short review.
- Publish your process: typical maintenance response times, how showings work, what you will need to apply.
- Respond to negative feedback with facts and a calm tone. Future renters read your response more than the complaint.
Two takeaways:
- Add one trust element to every listing: a "what to expect" block or a short FAQ.
- Trust increases application confidence and reduces time wasted on uncertain prospects.
Run Marketing Like a System: An Operational Checklist
Use this template to run marketing like a system. Copy and paste into your task manager and assign owners and dates.
Pre-Listing (30 to 60 Days Before Availability)
Goal: Build pipeline before the unit is empty.
- Confirm likely availability window (lease end date plus expected turn time).
- Draft "coming soon" listing with placeholder date, only if compliant and accurate.
- Refresh neighborhood highlights and commute points.
- Prepare screening criteria and publish clearly (income, credit, pets, fees).
- Set renewal outreach schedule (120, 90, 60, 30-day touches).
Examples
- A single-family rental: start "coming soon" 45 days out and begin waitlist capture.
- Small multifamily: stage one model unit's photos and reuse for identical floorplans.
If you wait until keys are returned, you have accepted avoidable vacancy.
Active Listing (0 to 21 Days Live)
Goal: Maximum exposure plus fast conversion.
- Distribute to major networks. Ensure consistent data fields.
- Headline format: price + beds and baths + standout feature.
- Upload 22 to 27 high-quality photos.
- Add a 3D tour (priority) and a short walkthrough video if possible.
- Enable rapid lead response: templates, auto-replies, scheduling link.
- Drip follow-up at 24 hours, 48 hours, 72 hours for unbooked inquiries.
- Refresh after 7 to 10 days if performance is weak (swap hero photo, tighten copy, verify price).
Examples
- If you have views but low inquiries, rewrite headline and lead photo first.
- If you have inquiries but low showings, fix response time and scheduling friction.
Track your inquiry-to-showing ratio weekly. It is the fastest diagnostic for messaging and response issues.
Post-Lease (Move-In Through Renewal)
Goal: Reduce future vacancy by retaining good tenants.
- Digital welcome packet plus a clear maintenance request channel.
- 30-day check-in to catch small issues before they become move-out reasons.
- 120 and 90-day renewal sequence with clear options.
- If non-renewal: launch pre-marketing, schedule vendors, and plan a fast turn.
Examples
- A proactive maintenance touch reduces frustration that often triggers non-renewal.
- An early renewal offer avoids the last-minute surprise that pushes tenants to shop elsewhere.
Retention is a marketing KPI. Put renewals on the same dashboard as leads and showings.
FAQ
How early should I list a rental to reduce vacancy?
If you know a likely availability date, start building visibility 30 to 60 days ahead. Use accurate "coming soon" messaging and capture leads for future availability. Market timing matters. Zillow notes renter activity spikes during peak rental season, so earlier visibility helps you ride demand waves instead of reacting to them. Earlier visibility also gives you time to refresh photos and copy if early performance is weak.
Do 3D tours and video really help, or are they optional?
They materially help. Apartments.com reports 23 times more leads for listings with 3D tours. Zillow has reported 68% more views for 3D Home tours. Even if your market is smaller, tours reduce uncertainty and help prospects self-qualify faster, which means fewer wasted showings and a higher inquiry-to-application conversion rate. The lead lift typically offsets the cost of producing the tour quickly.
What is the most efficient way to market multiple units without burning out?
Standardize your creative (headline formula, photo checklist, description blocks) and use distribution plus automation. A single source-of-truth listing and a central message inbox reduce errors and speed response. Two of the biggest drivers of vacancy. Posting midweek can also improve engagement consistency. Standardization is what makes multi-unit marketing sustainable when you are running a small team or working solo.
How do I reduce vacancy in the slow season (fall and winter)?
Lean harder into media quality (photos plus tour), faster follow-up, and proactive renewals so fewer units hit the market during low demand. Zillow publishes guidance on finding renters in fall and winter. Expect lower volume and plan earlier with a longer runway and stronger listing presentation. Defending occupancy through renewals matters more in slow seasons than in peak, because re-leasing risk is higher when overall demand is thinner.
Reduce Vacancy Starting Today
If you want the fastest path to fewer vacancy days, implement this in two moves.
First, adopt year-round visibility. Keep a lightweight continuous marketing engine running. Listings published when needed, "coming soon" preparation, and a waitlist for future availability. The unit you list next month should never start from scratch.
Second, consolidate operations into one workflow. When marketing, leasing, messaging, applications, lease signing, and renewal automation live in one connected system, you reduce dropped leads, shorten decision times, and improve lease end management.
This is exactly where Shuk's Year-Round Marketing differentiator comes in. Most rental software treats marketing as something you turn on at vacancy. Shuk keeps your listing current and ready to go live the moment you need it, so you never lose time rebuilding from scratch when a tenant gives notice. Your listing stays prepared, your media stays organized, and your pipeline stays warm.
Combined with Shuk's centralized in-app messaging with email and push notifications, e-signature for leases through our Adobe-powered integration, tenant screening via our screening partner, and the Lease Indication Tool that polls tenants monthly starting six months before lease end so you get early signals on renewal likelihood, the operational picture changes. Marketing stops being a scramble and becomes a system.
Book a demo at shukrentals.com/book-a-demo to see how Shuk's Year-Round Marketing, in-app messaging, e-signature for leases, tenant screening, and the Lease Indication Tool work together so the next time a unit comes available, your listing is ready, your pipeline is warm, and your days vacant are shorter.