Market Insights Hub
Move From Guessing to Managing With Intent: Rental Market Analysis for Independent Landlords
Rental decisions made on last year's rent or a neighbor's number get expensive fast. This hub covers pricing, vacancy, concessions, supply, and the monthly metrics that turn local data into better operating decisions.
Market Insights: Use Local Data to Make Better Pricing, Vacancy, and Retention Decisions Every Month
Rental market analysis works best when it is operationalized into a monthly cadence rather than a one-time review. The guides in this hub are organized by where market conditions are affecting your portfolio most today. Use the links below to find your entry point, then build toward a complete market monitoring practice over time.
Rental Market Trends: Start Here If You Are Unsure Whether Your Market Is Tightening or Loosening
Rental conditions in 2026 look calmer nationally but more fragmented locally. Zillow's February 2026 rent report shows 1.9% year-over-year growth with deceleration in 34 of 50 large markets and a median asking rent around $1,895. Apartment List reports a similar 1.9% year-over-year figure, reinforcing the broader slowdown. At the same time, Realtor.com reported top-50 metro asking rents down 1.7% year over year in February 2026, yet still 14% above February 2020 levels, which matters for affordability and tenant sensitivity to rent increases.
The national average hides big local swings. Treat trend data as a local scorecard rather than a portfolio-wide directive. If your metro is seeing concessions and elevated vacancy, your playbook should emphasize lease-up speed, targeted incentives, and retention. If your submarket is tight or rebounding, you can prioritize revenue optimization and selective upgrades while keeping renewal pricing aligned with what your current tenants can absorb without a move-out decision.
Pricing Your Rental Property: Start Here When Setting New-Lease Rent or Renewal Increases
Pricing is where rental market analysis pays back fastest because even small differences in positioning compound over time. Yet pricing is harder in a slow-growth environment. Yardi Matrix reported modest rent growth of approximately 0.7% nationally in 2025, highlighting why landlords cannot depend on automatic rent lifts tied to inflation. Independent landlord survey data indicates many housing providers are responding to higher ownership costs by planning 0% to 5% renewal increases and up to 10% on new leases, while a meaningful share choose no increase to protect retention.
A recommended pricing workflow: Use rent comps covering similar beds and baths, condition, parking, and pet policy to set a defensible range. Adjust for concessions since a $2,000 per month asking rent with one free month is not the same as $2,000 effective rent. Decide your priority between maximizing rent and minimizing vacancy days, then price accordingly. Avoid dependence on opaque algorithmic pricing tools. Landlords should rely on transparent, auditable inputs and local evidence to set prices they can explain and defend.
Reducing Vacancy Through Marketing: Start Here If Days-on-Market Are Creeping Up
Vacancy is both a revenue leak and a market signal. The U.S. rental vacancy rate hit 7.2% in Q4 2025, the highest since 2014, meaning many markets offer renters more choice than they had in prior years. When renters have choices, listing quality and speed-to-lead become competitive weapons. Zillow's finding that 39% of listings offer concessions implies your marketing must communicate value clearly, whether that value is effective rent, included utilities, parking, or flexible move-in terms.
A step-by-step approach to reducing vacancy days: Track days-on-market by unit type and season. When days-on-market rises, refresh photos, adjust headline pricing, and test incentives before making permanent rent cuts. Market the features renters say they value since NMHC and Grace Hill renter preferences research emphasizes that digital processes, responsive maintenance communication, and smart home features increasingly influence resident decisions. Keep a vacancy cost calculation handy: if one extra week vacant costs more than a modest rent adjustment, choose the faster lease-up rather than holding out for a higher number.
Tenant Demand Forecasting: Start Here to Get Ahead of Slow Seasons and New Supply
Demand forecasting is how you get ahead of slow seasons, new supply deliveries, and demographic shifts before they affect your occupancy. Redfin reported 18.8% of users searched outside their home metro in Q4 2025, a record high, with notable inflows to markets like Sacramento, Las Vegas, and parts of Florida and the Southeast. Remote work remains structurally meaningful, reported as 27.7% of workdays with 13.3% primarily remote, continuing to support dispersion from the highest-cost urban cores even if at a slower pace than 2021 and 2022.
Demographics also matter significantly. Industry coverage tied to NAIOP and RentCafe notes Gen Z renter households growing from approximately 700,000 to 4.4 million over five years, with affordability and flexibility shaping location and unit-type choices.
Three forecasting lenses to apply: Who is moving into your market covering migration, job growth, universities, and major employers? What are they choosing in terms of unit size, amenities, and commute expectations? And when does new supply hit based on pipeline timing in your submarket?
Competitive Positioning for Landlords: Start Here When Similar Units Are Offering Incentives
Competitive positioning is your answer to "why would a renter choose your unit" in a crowded listing environment. If similar units are offering incentives, you either match the market or out-execute it on something renters actually value. Zillow's concessions prevalence of 39% of listings suggests renters are actively comparing total deal value rather than sticker price. NMHC and Grace Hill renter preferences research reinforces that renters increasingly expect convenience through digital leasing workflows, responsive maintenance communication, and tech-forward living options.
Your positioning checklist: Clarify your value package and whether you compete on price, flexibility, or overall experience. Build proof points around fast maintenance response time, a transparent pet policy, and easy online payments. Prioritize unit readiness since move-in-ready is a competitive feature when inventory is high. Use technology to be faster and more consistent in your communications and leasing process, keeping your standards fair, compliant, and transparent.
Concessions, Renewals, and Retention Strategy: Start Here to Protect Occupancy and Net Operating Income
Concessions are not just a leasing tactic. They are a market signal. When concessions become widespread, it typically means renters have leverage due to elevated supply or rising vacancy. Zillow's finding that 39% of listings offer deals in early 2026 provides a clear benchmark: if your submarket looks similar, you need a policy for when to use incentives and how to measure their effectiveness rather than offering them automatically.
Retention is the other half of the equation. Survey work shows many landlords face rising ownership costs yet some choose to hold rents steady to preserve tenant satisfaction and reduce turnover costs. Retention reduces hidden costs covering make-ready labor, lost rent days, marketing expense, and screening time that rarely appear in a simple rent calculation.
To improve retention: Offer renewal term options such as 12 versus 18 months when demand is uncertain and a tenant may appreciate the flexibility. Replace across-the-board rent hikes with targeted increases tied to unit improvements or utility changes. Use effective rent math: a modest concession to retain a stable tenant can beat a higher asking rent followed by a vacancy gap and a make-ready cycle.
Supply Pipeline and New Construction: Start Here to Understand Near-Term Rent Pressure
Supply timing is one of the biggest drivers of near-term rent pressure in any submarket. Yardi Matrix forecasted approximately 548,000 multifamily completions in 2025, one of the highest volumes since the 1980s, and approximately 430,000 in 2026, alongside a pipeline of over one million units as of mid-2025, supporting continued supply pressure in certain metros into 2026. CoStar and Apartments.com reporting has described an inventory overhang consistent with vacancy hovering near the upper single digits in some market narratives.
What to monitor when new deliveries cluster near your property: New deliveries typically show up first as concessions at nearby new builds, then as slower leasing velocity, and only later as headline rent cuts. Compare effective rent at nearby new buildings including asking rent minus concessions, included amenities such as parking and smart entry, and lease terms. If you are in an overbuilt pocket, lean into differentiation through pet-friendly policies, bundled services, and faster maintenance response times, and consider defensive renewal strategies to reduce churn before it affects occupancy.
Market Metrics Dashboard: The Monthly Tracking Habit That Changes Everything
A strong dashboard turns market noise into decisions. At minimum, track these indicators monthly and weekly during peak leasing season.
Rent comps: new-lease asking rent versus achieved rent where available. Vacancy rate: your property vacancy versus market vacancy with the national reading of 7.2% in Q4 2025 as context, not a target. Days-on-market: by unit type with rising days-on-market as an early warning signal. Concessions prevalence: Zillow's 39% listing concession rate as a national benchmark with your submarket potentially higher or lower. Absorption and net leasing: when negative absorption appears in reports, pricing power tends to weaken. Turnover cost and retention: the full quantified cost of make-ready, leasing, and vacancy loss per unit per year.
Set trigger rules: if days-on-market exceeds your baseline by 25%, automatically test a refreshed lead photo set, broaden showing windows, and review effective rent versus your top five comps. If vacancy rises above the local market rate, prioritize renewal outreach earlier and tighten make-ready timelines to reduce the gap between move-out and re-lease.
What Operationalizing Market Analysis Actually Looks Like
A Midwest-based small portfolio landlord managing 18 doors across a mix of one to three-bedroom units moved from ad-hoc decisions to a monthly market analysis cadence. The backdrop looked challenging: multiple national sources showed rent growth slowing to approximately 1.9% year over year by early 2026, vacancy nationally rising to 7.2% in Q4 2025, and concessions becoming common with 39% of listings offering some form of incentive.
What changed: They built a comp set for each unit type and tracked effective rent rather than headline asking rent. They implemented days-on-market triggers so that when a unit exceeded the portfolio's 30-day lease-up goal, the system prompted a pricing review, updated photos, and an expanded showing schedule. They aligned renewals with market conditions: where comps were soft, they offered modest increases paired with longer lease terms to reduce turnover risk.
Measured results over six months: Vacancy days decreased 15%. Average achieved rent on new leases increased 8%, driven by tighter comp discipline and fewer panic discounts. Concession spend dropped 12% because incentives became targeted rather than automatic. The key lesson: rental market analysis works best when it is operationalized into a consistent monthly process backed by data and executed on time, not when it is a sporadic deep dive that happens once at vacancy.
Frequently Asked Questions
What is rental market analysis for landlords in plain terms?
It is the practice of using local data covering rent comps, vacancy, days-on-market, supply pipeline, and concessions to make better rental decisions about how much to charge, what incentives to offer, when to renovate, and how to time renewals. National numbers like 1.9% year-over-year rent growth provide context, but your performance is driven by your neighborhood and competitor set. The goal is not perfect prediction. It is reducing avoidable mistakes including overpricing, underpricing, slow leasing, and unnecessary concessions.
Which data sources are most credible for monitoring rents and vacancy?
Use a blend of sources and cross-check them since each has different coverage and methodology. Zillow's ZORI provides consistent national and metro-level rent trend signals and concessions prevalence data. Redfin's rental tracker offers metro comparisons and directional rent movement. The U.S. Census Housing Vacancies and Homeownership Survey provides a government benchmark on rental vacancy, currently 7.2% in Q4 2025. Yardi Matrix covers supply pipeline and multifamily market context including deliveries and completions forecasts. Cross-referencing at least two sources before making a pricing decision is standard practice.
How do I price correctly when rent growth is slowing?
Start with comps and work outward. Price within a defensible comp range. Convert all competitor deals to effective rent, especially when concessions are common, since 39% of listings nationally offer some form of incentive. Decide your objective between maximizing rent and minimizing vacancy. In a higher-vacancy environment, the cost of extended downtime can exceed the upside of a slightly higher asking rent. Reprice quickly when days-on-market is rising. Waiting is usually more expensive than adjusting early.
How can I stay competitive without racing to the bottom on price?
Compete on the full value bundle rather than headline rent alone. A better leasing experience through digital applications and faster responses aligns with what renter preferences research shows renters increasingly expect. Clear policies around pets, parking, and utilities plus clean high-quality listings reduce friction in the decision process. Targeted concessions rather than permanent rent cuts protect net operating income while still matching market behavior. Stable occupancy and predictable cash flow are the win, not the highest possible headline rent.
How often should I update my market analysis?
At minimum, monthly, and more often during peak leasing season or when your market is changing quickly due to new supply deliveries. Yardi's forecasting described a heavy completion year in 2025 followed by a still-large 2026 delivery year, meaning competitive conditions can shift as new buildings open nearby. Weekly checks of days-on-market, lead volume, and showing conversion can prevent small slowdowns from turning into extended vacancies that are expensive to recover from.
If you want a simpler way to operationalize rental market analysis without stitching together spreadsheets and scattered reports, book a demo to see how Shuk's listing tools, lease tracking, and tenant communication workflows support the operational execution that turns market data into decisions that show up in occupancy and revenue over the next leasing cycle.
{
"@context": "https://schema.org",
"@type": "FAQPage",
"mainEntity": [
{
"@type": "Question",
"name": "What is rental market analysis for landlords in plain terms?",
"acceptedAnswer": {
"@type": "Answer",
"text": "It is the practice of using local data covering rent comps, vacancy, days-on-market, supply pipeline, and concessions to make better rental decisions about how much to charge, what incentives to offer, when to renovate, and how to time renewals. The goal is reducing avoidable mistakes including overpricing, underpricing, slow leasing, and unnecessary concessions."
}
},
{
"@type": "Question",
"name": "Which data sources are most credible for monitoring rents and vacancy?",
"acceptedAnswer": {
"@type": "Answer",
"text": "Use a blend of sources. Zillow's ZORI provides consistent national and metro-level rent trend signals and concessions prevalence data. Redfin's rental tracker offers directional rent movement. The U.S. Census Housing Vacancies and Homeownership Survey provides a government vacancy benchmark currently at 7.2% in Q4 2025. Yardi Matrix covers supply pipeline and completions forecasts. Cross-reference at least two sources before making a pricing decision."
}
},
{
"@type": "Question",
"name": "How do I price correctly when rent growth is slowing?",
"acceptedAnswer": {
"@type": "Answer",
"text": "Start with comps and work outward. Price within a defensible comp range and convert all competitor deals to effective rent since 39% of listings nationally offer some form of incentive. In a higher-vacancy environment, the cost of extended downtime can exceed the upside of a slightly higher asking rent. Reprice quickly when days-on-market is rising since waiting is usually more expensive than adjusting early."
}
},
{
"@type": "Question",
"name": "How often should I update my rental market analysis?",
"acceptedAnswer": {
"@type": "Answer",
"text": "At minimum monthly, and more often during peak leasing season or when new supply is delivering in your market. Yardi's forecasting describes heavy completion volumes in 2025 and 2026, meaning competitive conditions can shift as new buildings open nearby. Weekly checks of days-on-market and lead volume can prevent small slowdowns from turning into extended vacancies."
}
},
{
"@type": "Question",
"name": "How can I stay competitive without racing to the bottom on price?",
"acceptedAnswer": {
"@type": "Answer",
"text": "Compete on the full value bundle rather than headline rent alone. A better leasing experience, clear policies around pets and parking, and targeted concessions rather than permanent rent cuts protect net operating income while matching market behavior. Stable occupancy and predictable cash flow are the win, not the highest possible headline rent."
}
}
]
}
Shuk helps landlords and property managers get ahead of vacancies, improve renewal visibility, and bring more predictability to every lease cycle.
Book a demo to get started with a free trial.
The following guides cover every dimension of rental market analysis for independent landlords and property managers: how to interpret national and local rent trend signals and identify whether your submarket is tightening or loosening, how to price new leases and renewals with a defensible comp-based process, how to reduce vacancy days through marketing discipline and listing quality, how to forecast tenant demand using migration, employment, and demographic signals, how to position your unit competitively when inventory is elevated, how to use concessions and renewal strategy to protect occupancy and net operating income, how to monitor the supply pipeline for near-term rent pressure, and how to build a monthly metrics dashboard with actionable trigger rules. Together they provide a repeatable framework that turns market noise into operational decisions.
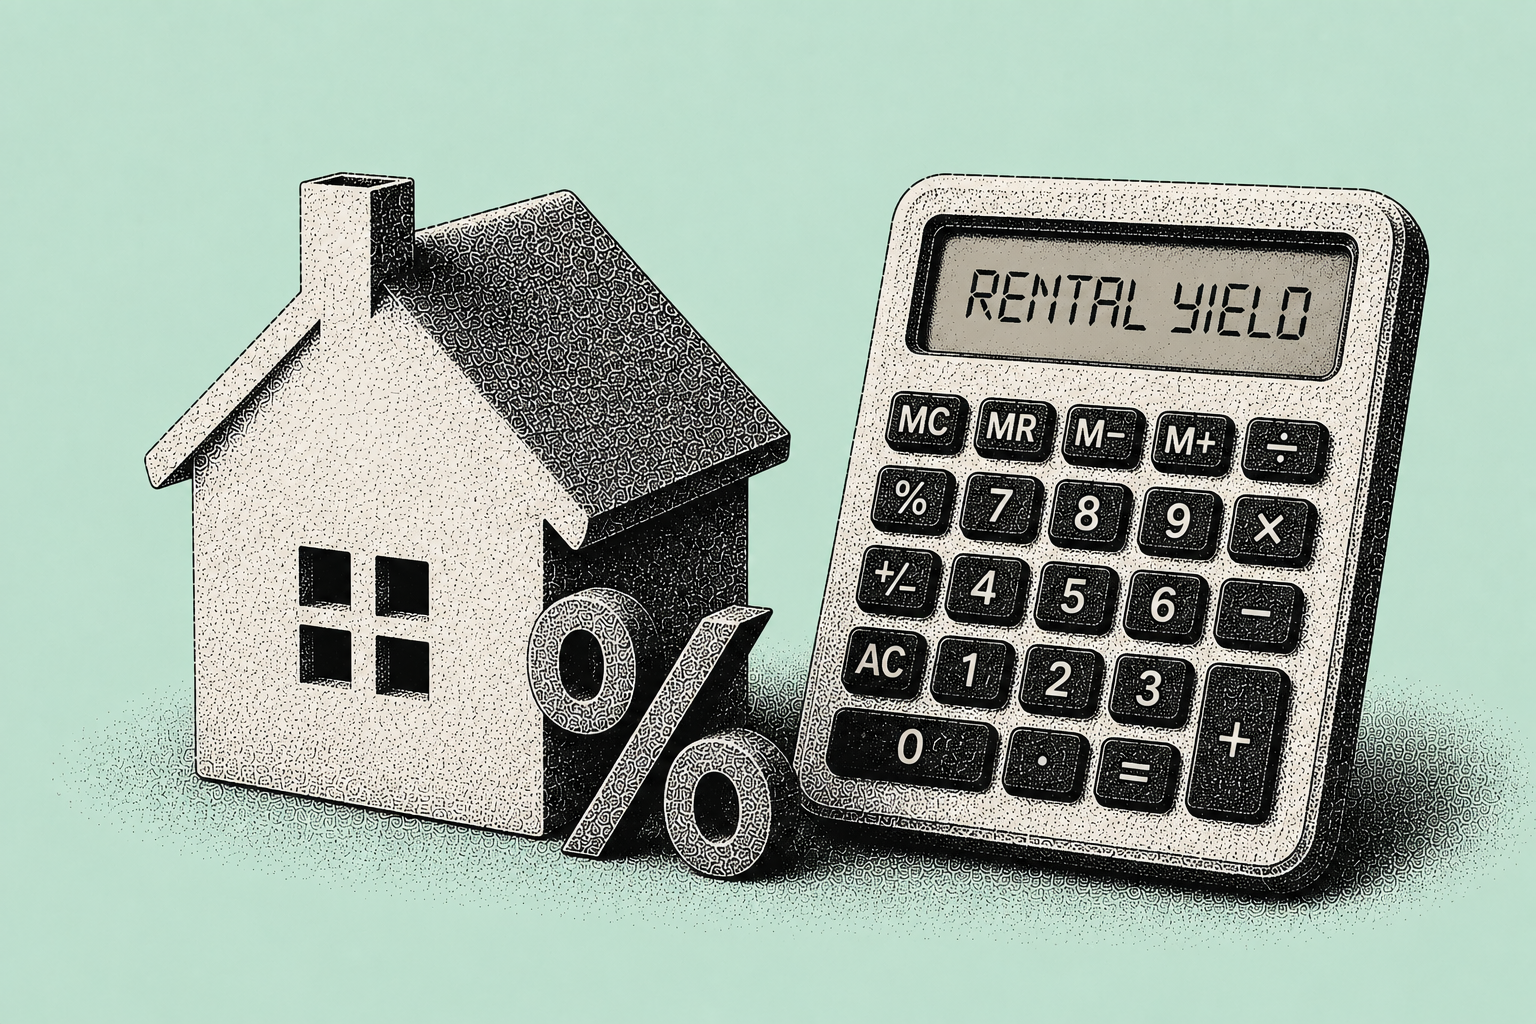
How to Calculate Rental Yield (and Why It Matters More Than Rent-to-Price Gut Checks)
Stop Relying on Rent-to-Price Gut Checks
A surprising number of landlords "know" their property is performing well until they run the numbers the way a lender, buyer, or CPA would. The most common trap: relying on a rent-to-price gut check while ignoring vacancy, repairs, and the slow drip of operating costs that quietly compress returns. Two properties can advertise identical monthly rent and look the same on paper, yet deliver very different outcomes. One produces stable, predictable cash flow; the other bleeds money whenever a tenant turns over or a major system fails.
That is why rental yield matters. It is a simple metric, but only when it is calculated consistently and interpreted in context. Nationally, gross rental yields have been hovering in the mid-to-high single digits, about 6.71% in Q2 2026 on a nationwide basis, according to Global Property Guide data. Within the same dataset, you see huge city-to-city spread: Los Angeles around 4.59% versus Chicago around 8.59% for one-bedroom units. If you use the wrong yield (or the right yield with the wrong inputs), you can overpay for an acquisition, under-budget expenses, or misjudge which unit types deserve your next capital dollar.
Note: This article provides general education about rental yield calculation and benchmarks, not financial advice. Yield estimates, operating expense ratios, and market conditions vary. Before making investment decisions, consult qualified professionals.
This guide shows exactly how to calculate rental yield, gross vs. net, plus practical benchmarks for urban, suburban, and rural markets, common mistakes to avoid, and how consistent income and expense tracking supports accurate yield measurement.
What Rental Yield Measures
Rental yield measures how much income a rental property generates relative to its value. In its simplest form, it answers: "How hard is my property working for the capital tied up in it?" Most landlords use rental yield for three core decisions: acquisitions (comparing properties across neighborhoods with very different price points), performance checks (seeing whether rent increases, expense controls, or operational changes are improving results), and hold vs. sell (deciding when appreciation has outpaced rent growth enough that yield is now lagging).
There are two versions you should understand:
Gross rental yield ignores operating expenses. It is a fast screening tool that uses annual rent and property value.
Net rental yield subtracts operating expenses (taxes, insurance, maintenance, management, vacancy allowance, utilities you pay, etc.) for a more realistic view of ongoing performance.
Both are useful, just for different jobs. Gross yield helps you compare quickly; net yield helps you decide confidently.
A few data points set expectations. On the higher end, some lower-priced markets can show very high yields (for example, Detroit at roughly 21.95% and Cleveland at roughly 16.59% in one recent yield comparison using local price and rent estimates from Rentometer). On the lower end, expensive coastal markets can compress yields (for example, Santa Clara as low as roughly 3% in ATTOM's analysis). Those figures are gross-like snapshots; your net yield will depend on vacancy and expenses, often the difference between "looks great" and "actually great."
Step-by-Step: How to Calculate Gross and Net Rental Yield
1) Start with the Two Formulas
Gross Rental Yield = (Annual Rental Income / Property Value) x 100
Net Rental Yield = (Annual Rental Income minus Operating Expenses) / Property Value x 100
Property value choice: Use purchase price for acquisition analysis, and current market value for ongoing performance comparisons. Be consistent. Mixing the two can make yield "improve" or "worsen" on paper for reasons unrelated to operations.
2) Calculate Gross Yield (Quick Screen)
Scenario (suburban single-family): Monthly rent: $2,400. Annual rent: $2,400 x 12 = $28,800. Purchase price (or value): $360,000.
Gross rental yield: ($28,800 / $360,000) x 100 = 8.0%.
8% gross is often a strong starting point in many U.S. markets when compared to the roughly 6.71% national average gross yield reported in Q2 2026 per Global Property Guide. But gross yield can flatter properties with deferred maintenance or optimistic vacancy assumptions, so do not stop here.
3) Build Your Operating Expense Stack (for Net Yield)
Net yield hinges on what you include. Planning ranges: property taxes (often 0.5% to 3% of value depending on location), property management (typically 8% to 12% of monthly rent), maintenance (often budgeted around 1% to 2% of property value annually, per Investopedia), vacancy allowance (commonly 5% to 8% of rental income; national rental vacancy has been around roughly 7% in recent data series).
These are planning ranges, not guarantees. A new roof is a capital expense, while routine repairs and turnover cleaning are operating. Mixing capex into operating expenses will understate yield in good years and overstate it in bad years.
Use a vacancy allowance even if you are currently fully occupied. Underwriting "zero vacancy" is one of the fastest ways to overestimate net rental yield.
4) Calculate Net Yield (Realistic Performance)
Continue the suburban scenario: Annual rent: $28,800. Operating expenses (annual): Taxes (1.4% of $360,000 = $5,040). Insurance: $1,400. Maintenance (1.5% of value = $5,400). Management (10% of rent = $2,880). Vacancy allowance (6% of rent = $1,728). Total operating expenses = $16,448. NOI proxy = $28,800 minus $16,448 = $12,352.
Net rental yield: ($12,352 / $360,000) x 100 = approximately 3.43%.
That is a dramatic difference from 8% gross, because expenses are real. This is exactly why landlords should always know both numbers.
In markets like Detroit (roughly 21.95% gross), expenses and vacancy can also be higher, and insurance/taxes can behave differently, so the net yield gap can be large even when gross looks exceptional. High gross yield is not the same as low risk.
5) What Is a "Good" Yield? Benchmarks by Market Type
Use benchmarks as guardrails, not rules:
Urban core. Often lower yields because prices are high. Los Angeles around 4.59% gross and Manhattan around 6.21% gross in cited city sets per Global Property Guide. A "good" net yield in many urban cores may be modest if stability and liquidity are strong.
Suburban. Suburban rent growth has recently been slightly higher than urban in at least one national comparison (2.5% vs. 2.3%, per Stessa), which can support yields if purchase prices do not outpace rents. A "good" gross yield may cluster around the national gross average (roughly 6% to 7%) or higher.
Rural. Data is thinner and more variable; Zillow notes rural markets can behave differently and may require supplementary local data. In practice, you will see a wider range: some rural rentals have strong yields due to low prices; others struggle with longer vacancy and thinner tenant pools.
Compare your yield to local comps first, and the national average second. A 6% gross yield might be great in one market and weak in another.
6) Yield vs. ROI vs. Cash Flow
Rental yield: income relative to property value. Great for comparing assets. Cap rate: essentially NOI/value, functionally similar to net yield when you are using NOI (and excluding financing). ROI: broader, can include cash flow, principal paydown, tax effects, and appreciation, per Investopedia. Cash flow: what is left after operating expenses and debt service. A property can have decent net yield but negative cash flow if financing costs are high.
Example. Two $400,000 properties each have $14,000 NOI (3.5% net yield). Property A has a low-rate loan and positive cash flow; Property B has a high-rate loan and negative cash flow. Same yield, very different owner experience.
7) Common Calculation Mistakes to Avoid
Using monthly rent instead of annual rent in the numerator. Ignoring vacancy (or assuming "my tenant never leaves"). Forgetting irregular-but-real costs like turnover, leasing fees, or periodic maintenance. Mixing capex with operating expenses inconsistently. Using estimate-like values without sanity checks: choose a value basis you can defend.
Rental Yield Worksheet
Run this for each property at least quarterly.
Property info: Address / Unit ID. Market type (Urban / Suburban / Rural). Value basis (Purchase price / Current market value). Property value used.
Income: Contract monthly rent. Other monthly income (parking, pet, storage). Gross monthly income. Annual rental income (x12).
Vacancy and credit loss: Vacancy allowance % (typical underwriting range 5% to 8%). Annual vacancy allowance $.
Operating expenses (annual): Property taxes (often 0.5% to 3% of value). Insurance. Management (often 8% to 12% of rent). Repairs and maintenance (often 1% to 2% of value). Utilities (owner-paid). HOA / condo fees. Landscaping / snow. Other. Total operating expenses.
Calculations: Gross rental yield: (Annual rental income / Property value) x 100 = %. Net operating income (NOI proxy): Annual income minus Total operating expenses = $. Net rental yield: (NOI proxy / Property value) x 100 = ___%.
Two quick interpretation prompts: If gross yield looks strong but net yield is weak: which 2 to 3 expense lines are driving it? If net yield is stable but cash flow is tight: is financing (rate/terms) the constraint?
Frequently Asked Questions
Is rental yield the same as cap rate?
They are closely related when you use NOI. Cap rate is typically defined as NOI divided by property value and expressed as a percentage. Net rental yield uses the same structure when "operating expenses" are defined to produce NOI. In practice, landlords often say "net yield" for rentals and "cap rate" for investment property pricing.
How often should I recalculate rental yield?
At minimum: quarterly and at every rent change or major expense event. Vacancy, insurance renewals, tax reassessments, and maintenance can shift net yield quickly.
How do I account for vacancy correctly?
Use a vacancy allowance (commonly 5% to 8% in underwriting), even if your units are currently full. Example: $30,000 annual rent x 6% = $1,800 vacancy reserve.
What if my market has limited rural data?
Zillow's research highlights that rural markets can have different dynamics and sometimes thinner data coverage. Pull multiple local comps, track your own vacancy/turnover history, and be conservative with expenses.
What to Do Next
If you are calculating yield manually, the math is not the hard part. Keeping inputs accurate over time is. Rents change. Insurance renews. Taxes adjust. Maintenance spikes. And if expenses are not categorized consistently, your net rental yield can drift into a number you cannot confidently defend.
Shuk's payment and income reports are filterable by property, tenant, and date and exportable to PDF or Excel, so your rent collection records give you accurate income data per property. Schedule E-aligned expense organization with digital receipts keeps operating costs categorized consistently, so your expense inputs for the yield calculation are reliable and current. Together, these give you the data to calculate gross and net rental yield accurately rather than estimating from bank balances.
At $5 per unit per month with no setup fees, and with White Glove Onboarding included at no additional cost, Shuk makes property-level financial tracking feasible for landlords and property managers running 1 to 100 units.
Book a demo at shukrentals.com/book-a-demo to see how income and expense reporting work together so your yield calculations are based on real data, not assumptions.

Competitive Positioning for Landlords
"Nice and clean" is not a competitive advantage. It is table stakes.
Renters scroll through dozens of similar listings in minutes, and most landlords react in one of two ways. They drop rent, or they rush into scattered upgrades. Both can backfire. Price cuts attract volume, not necessarily the right residents. Random improvements add cost without creating a clear reason to choose your property.
Competitive positioning is the landlord's alternative. A disciplined way to define who your rental serves best, what you do better than nearby options, and how you prove it consistently. The goal is not to appeal to everyone. It is to be the obvious choice for a specific renter segment in your local market.
This matters because affordability pressures are real. Redfin reported that 22% of renters spend their entire income on rent, and many are taking second jobs or relying on savings and family support to make housing work. When budgets are tight, renters become more selective. They look for certainty (reliable internet, safety, responsiveness), convenience (in-unit laundry), and trust (clear expectations and honest communication). Zillow's 2024 Consumer Housing Trends work found that 94% of renters say staying within budget is essential, and 82% feel housing prices are too high.
This guide shows you how to build a competitive advantage that reduces vacancy time, supports premium rent when justified, and strengthens your reputation year after year.
Competitive Positioning Is the Answer to Three Questions
Competitive positioning for landlords is the practical craft of answering three questions:
Who is my best-fit renter? Not just "any qualified applicant," but the renter profile most likely to value what you offer and renew. Zillow's research shows a typical renter profile skewing younger (around 39), more diverse, lower income than homeowners, and more likely to own pets. That has direct implications for pet policies, tech expectations, and how you communicate.
What do I do better than nearby alternatives? This requires local competitor analysis, not guesswork. Amenities and service levels (communication, responsiveness, frictionless processes) are often where small landlords can outperform larger operators.
How do I prove it? Your photos, listing language, screening process, maintenance response, and online reputation do the proving. AppFolio's renter research highlights that renters satisfied with property management are 30% less likely to move and 5.5 times more likely to recommend their management company. Satisfaction with communication reduces move intentions by 25%. Operational excellence is marketing.
Positioning is not only about adding features. It is about aligning features, pricing, and renter experience into a coherent promise. Examples:
- A small duplex positioned as a "quiet, work-from-home stable": reliable high-speed internet, sound-dampening fixes, and proactive maintenance windows.
- A modest single-family rental positioned as a "pet-inclusive home": clear pet policy, durable flooring, and a yard-ready setup.
- A downtown condo positioned as "smart, secure, low-friction living": smart lock access, package instructions, and digital rent workflows.
The steps below give you a repeatable way to design your position, communicate it when you list your rental, and back it up with systems that create accountability so your advantage compounds instead of fading.
Step 1: Define Your Target Renter Persona and Your "Why You" Value Proposition
Competitive positioning starts with choosing who you serve best. Your target renter persona is a practical profile, not a stereotype. Built around needs, budget constraints, deal-breakers, daily routines, and what makes them renew.
Zillow's 2024 trends show affordability is critical (94% insist on staying in budget) and renters increasingly value lifestyle fit, like pet accommodation and shared amenities. NMHC and Grace Hill's 2024 survey underscores must-haves that shape expectations: 93% prioritize in-unit washer / dryer (along with A/C), and 86% are interested in or require reliable internet.
Build your persona in 20 minutes
- Pull your last 3 to 5 great renters. What did they value? What did they complain about? Why did they renew or leave? If you do not know, that is a signal to start capturing feedback.
- Map jobs to be done: quiet for sleep, space for pets, commute convenience, stable costs, fast maintenance.
- Define 3 deal-breakers and 3 delighters.
Then write your one-sentence value proposition
"For [persona], our rental delivers [top 2 to 3 outcomes] through [proof points], with [service promise]."
Examples
Remote worker couple: "Reliable internet-ready unit, quieter bedroom, and clear repair scheduling, so your weekdays run smoothly." Ties to internet requirement and communication satisfaction.
Pet-forward renter: "Pet-inclusive home with durable finishes, clear rules, and fast maintenance response." Pet friendliness is repeatedly cited as a major lease decision factor.
Security-minded renter: "Secure access, great lighting, and transparent expectations, built for peace of mind." Security is a significant decision factor.
Your value proposition becomes the filter for every choice. Amenities, rules, vendor standards, pricing stance, and how you communicate.
Step 2: Analyze Local Competitors and Identify Positioning Gaps (Not Just Rent Comps)
Most landlords do "comps" as a rent-only exercise. Positioning requires experience comps. What renters get at similar price points, and where there is an underserved niche.
Start with 10 to 15 nearby listings within
- Same bedroom count, plus or minus 1
- Similar neighborhood or submarket
- Similar property type (single-family vs. small multifamily vs. condo)
Audit each listing across five renter-facing categories
- Basics: A/C, heating, parking, laundry setup
- Connectivity: internet readiness, cell reception mentions, work-from-home suitability (often missing, an opportunity)
- Pet policy clarity: allowed types and sizes, fees, any pet amenities
- Trust signals: lease transparency, clear screening criteria, responsiveness cues
- Friction level: online application, self-tour options, scheduling ease
Research shows renters respond strongly to management quality and communication. AppFolio found satisfaction with property management correlates with lower move likelihood and far higher recommendation rates. That means your gap might not be an amenity. It might be operational reliability you can prove.
Common gaps small landlords can exploit
Internet clarity gap. Many listings say "tenant pays utilities" and stop there. Yet 86% of renters are interested in or require reliable internet.
Laundry gap. If nearby units lack in-unit laundry, adding it can move you into a less crowded competitive set. In NYC examples, in-unit washers and dryers have been cited with meaningful rent lifts. A market-specific case write-up cited 15%.
Pet-inclusion gap. If others are "no pets," a well-managed pet policy can differentiate and expand demand. Best Friends Animal Society reports landlords have seen an 11.6% rental premium for pet-friendly properties and longer tenancy (23 to 46 months longer) in their cited analysis.
Deliverable: a one-page Positioning Gap Map
Three columns:
- Market standard (must match)
- Underserved demand (your opportunity)
- Overbuilt features (avoid spending)
This prevents you from copying the wrong improvements and helps you choose a position renters will actually notice.
Step 3: Differentiate With Amenities and Upgrades That Pay Back
A competitive position becomes real when it is backed by tangible features. The trick is choosing upgrades that matter to your target persona, are defensible against nearby alternatives, and reduce management burden rather than increase it.
Anchor your upgrades in renter preference data
- NMHC and Grace Hill report 93% of renters prioritize in-unit washer / dryer and A/C.
- Renters are also inclined to pay more for features like high-speed internet and air conditioning.
- Zillow notes shared amenities (rooftop decks, fitness centers, pet areas) grew in popularity post-pandemic.
High-ROI, small-landlord-friendly upgrades
In-unit laundry (or compact laundry where feasible).
- Positioning: "Time-saving convenience" for busy professionals or families.
- Why it works: laundry is a top stated priority.
- Management tip: choose standardized models and a clear maintenance clause to reduce service calls.
Smart thermostat plus basic smart access (where appropriate).
- Positioning: "Modern, energy-aware home."
- Why it works: NMHC highlights interest in smart home tech and renters' willingness to pay for convenience and efficiency.
- Proof point: case studies in smart tech retrofits show improvements in satisfaction and operational efficiency.
Pet-forward durability package.
- Positioning: "Pet-inclusive without the drama."
- What it includes: scratch-resistant flooring, easy-clean paint, yard rules, designated pet area (even small).
- Data tie-in: reported rent premium and longer stays for pet-friendly rentals.
Micro case example: amenity-driven positioning
A small landlord with a 2-bed unit competing against similar stock adds a compact washer / dryer, updates lighting, and clarifies "internet-ready" in the listing (router location, provider options). They do not win by being cheapest. They win by eliminating daily friction and signaling reliability, aligned with top preferences for laundry and internet.
Rule of thumb: if an upgrade increases complexity (specialty parts, frequent breakage, unclear responsibility), it must produce a clear rent premium or vacancy reduction. Otherwise you are buying future headaches.
Step 4: Build Trust With Transparent Reputation Systems
Your property's competitive position is only as credible as the renter's ability to verify it. That is why reputation, especially transparent landlord-tenant reviews, has become a practical differentiator.
Two data points show why this matters operationally. AppFolio found that renters satisfied with property management are 30% less likely to move and 5.5 times more likely to recommend their management company. MIT-focused analysis summarized in industry commentary highlights a measurable link between tenant satisfaction scores and business outcomes (renewals, rent growth, and vacancy rates), with satisfaction increasing renewal likelihood by 8.6% and recommendation by 11.5%.
For individual landlords, the play is not "chase five-star ratings." It is to create accountability for landlords and renters: clear standards, documented communication, and fair resolution paths.
How to use a review system ethically and effectively
Ask at the right moments. After a resolved maintenance request, at 60 days post move-in, and at renewal.
Request specifics, not stars. "Was scheduling easy?" "Was the repair completed as promised?" This produces credible narratives rather than vague praise.
Publish your standards. Response-time targets, emergency process, quiet hours policy, pet rules. Reviews are most valuable when readers can compare experiences to stated expectations.
Respond like an operator. When criticism appears, reply with facts, empathy, and what changed. This can increase trust even with imperfect ratings.
Mini case study: repositioning plus reviews plus vacancy reduction
A self-managing landlord ("Marina," 3-unit building) faced 45 to 60-day vacancy cycles because prospects toured, then hesitated. She repositioned one unit around "quiet, pet-welcoming, internet-ready living." Changes included adding a pet-friendly durability package, clarifying pet rules and fees in writing, and installing a basic smart thermostat. She then implemented a simple review workflow. Renters received a request for feedback after every maintenance completion and at 90 days, and the landlord displayed summarized feedback alongside listing information. Within two turns, she saw noticeably fewer ghosted follow-ups and cut average vacancy closer to 20 to 25 days. The key was not just upgrades. It was the combination of promise plus proof.
Positioning is faster when trust is visible. If renters can verify that you communicate well and keep commitments, you do not have to compete purely on price.
Step 5: Use Predictive Rental Management to Prevent Vacancy Before It Starts
Most vacancy "surprises" are not surprises. They show up as early signals. Slower rent payment cadence, repeated small complaints, long gaps between maintenance and completion, or disengaged communication. Predictive rental management is the practice of turning those signals into proactive actions before the renter decides to leave.
Industry research connects satisfaction to renewals and vacancy outcomes. AppFolio's findings tie management satisfaction and communication directly to reduced move intention. MIT-linked analysis indicates satisfaction scores correlate with renewal likelihood and recommendations.
A lightweight predictive system (works for 1 to 20 units)
Track friction events. Late maintenance scheduling, repeat issues, after-hours complaints, payment questions.
Add a quarterly stay interview (5 minutes).
- "What is one thing we should fix?"
- "Anything that might keep you from renewing?"
- "How is internet reliability, noise, or comfort?"
This aligns with known drivers like reliable internet and comfort priorities.
Create renewal lead time. Start renewal conversations 90 to 120 days out.
Offer targeted fixes instead of blanket discounts. Add a better window covering to reduce heat gain, or install a smart thermostat to address comfort and efficiency preferences.
Examples of predictive interventions
Internet complaints (work-from-home persona). Add clear provider options, upgrade router placement, or document wiring. Since 86% care deeply about reliable internet, this can be a renewal save.
Pet tension (pet-inclusive position). Tighten pet policy enforcement consistently, add pet waste station rules, and respond fast to neighbor concerns. This protects the building's social environment.
Communication drop-off. Standardize response windows and use a single maintenance intake channel. Communication satisfaction reduces move intent.
Predictive management does not require AI magic. It requires consistency, tracking, and acting early so your competitive position (reliable, responsive, low-friction) is experienced year-round, not just during leasing.
Step 6: Maintain Year-Round Listing Visibility With Optimized, Honest Online Marketing
Many small landlords market only when a unit is vacant. Competitive operators maintain always-on visibility so the next vacancy is filled faster and with better-fit applicants. HUD research emphasizes that vacancy duration is a powerful indicator of market conditions and varies by submarket. Reducing days vacant is a major financial lever.
Year-round visibility tactics (practical and compliant)
- Keep a "coming soon" waitlist page (where allowed) and refresh photos annually.
- Collect permission-based leads from showings ("If another unit opens, want a heads-up?").
- Maintain a consistent listing template so you can list your rental quickly without scrambling.
Optimize your listing for conversion (not hype)
Lead with your position. First 2 lines should match your persona. Example: "Quiet 2BR with in-unit laundry and internet-ready setup, ideal for work-from-home schedules."
Prove the top 3 claims. "In-unit washer / dryer (model and year)," "A/C type," "Parking details."
Reduce uncertainty. Publish screening criteria, lease length options, pet rules, and typical utility ranges where feasible. Zillow's research suggests renters are highly budget-sensitive (94% prioritize staying within budget). Budget clarity is a differentiator.
Show management reliability. Mention response expectations and maintenance process, because management satisfaction and communication are tied to retention and recommendation.
Examples of positioned listing angles
- Pet-inclusive family rental: "Fenced yard rules, durable flooring, clear pet screening, and quick maintenance scheduling."
- Smart-secure urban unit: "Smart entry, well-lit access, package instructions, and digital rent workflows."
- Affordability-first unit: "Transparent fees, simple application steps, and predictable maintenance scheduling."
Always-on marketing is not about advertising spend. It is about making your unit easy to understand, easy to trust, and easy to apply for, so your positioning shows up before the tour even happens.
Step 7: Build a Contractor and Service Network That Reinforces Your Brand Promise
Your competitive position will collapse if maintenance is slow, inconsistent, or unpredictable. That is why "find contractors for rental property" is not just an operations task. It is a positioning strategy. If you claim "responsive management," your vendors must make that true.
Start with the renter experience you are promising
- "Low-friction living" requires fast scheduling and fewer repeat visits.
- "Pet-inclusive" requires vendors who can handle odor control, flooring durability, and quick turn cleanup.
- "Smart-secure" requires contractors comfortable with basic devices (thermostats, locks) and good documentation.
Build a small, reliable bench (3 tiers)
- Tier 1 (core): handyman, plumber, electrician, HVAC.
- Tier 2 (turnover): painter, cleaner, flooring.
- Tier 3 (differentiators): low-voltage and internet wiring help, smart device installer, landscaping.
How to vet and standardize
- Require written estimates, photos of completed work, and a clear warranty period.
- Set expected response times for emergencies vs. non-urgent issues.
- Use one maintenance intake path so renters do not vendor-shop or bypass process. This creates accountability for landlords and renters and reduces disputes.
Examples of contractor-network positioning benefits
Faster turns. HUD materials on achieving shorter turnaround emphasize process discipline. While targeted to larger programs, the operational principle holds. Shorter vacant time matters.
Fewer escalations. Consistent vendors learn your property quirks, reducing repeat fixes.
Better reviews. When maintenance is predictable, it improves the very satisfaction and communication outcomes tied to retention and recommendations.
Positioning is not a tagline. It is the lived experience of your service delivery. A dependable vendor bench is how you make that experience repeatable.
Competitive Positioning Worksheet
Use this checklist to design or refresh your competitive position in one sitting.
A) Your target renter persona (choose one primary)
- Persona name: ___
- Likely priorities (pick 3): budget certainty, in-unit laundry, reliable internet, pet-friendly, security, quiet / WFH, parking
- Deal-breakers (pick 3): ___
- "Will renew if": ___
B) Your 1-sentence value proposition
For ___ (persona), this rental delivers ___ (top outcomes) through ___ (proof points), with ___ (service promise).
C) Your local gap map (10 to 15 listings)
- Market standard (must match): ___
- Underserved demand (your wedge): ___
- Overbuilt features to avoid: ___
D) Proof points to add to your listing
- Top 3 features to prove with photos: 1, 2, 3
- Budget clarity items to disclose: utilities, fees, deposits, parking
- Process clarity items: screening, pet policy, maintenance channel, response time
E) Reputation and reviews plan
- Review request moments: after maintenance, 90 days, renewal
- Where you will capture reviews: ___
- Response standard for negative feedback: ___
F) Predictive rental management signals (track monthly)
- Top 5 friction events to log: ___
- Renewal outreach date: ___ (90 to 120 days before lease end)
G) Contractor network scorecard
- Tier 1 vendors identified? Yes or no
- Standard documentation required: estimates, before / after photos, warranty
- Backup vendor per category? Yes or no
If you complete A through D, you will already be ahead of most local competition. If you complete E through G, you will sustain the advantage.
FAQ
Can I justify higher rent with positioning, or will renters just pick the cheapest option?
Positioning can support higher rent when it reduces uncertainty and adds valued features. But it must be credible and aligned with renter priorities. Zillow reports that 94% of renters consider staying within budget essential, so price sensitivity is real. The win is to be the best value for a specific renter, not universally the cheapest. Pair any rent increase with proof points and transparent expectations rather than expecting the price alone to land.
What amenities matter most right now if I only have budget for one improvement?
If your property can support it, in-unit laundry consistently ranks as a top driver. NMHC and Grace Hill report 93% prioritize an in-unit washer and dryer. If laundry is not feasible, the next best move often relates to connectivity and comfort: reliable internet readiness (86% interest or requirement) and A/C. For pet-heavy submarkets, a well-managed pet-inclusive policy can expand demand and potentially lift rent (an 11.6% premium in Best Friends' summary).
How do landlord-tenant reviews help if I am a small landlord without a big brand?
Reviews reduce the trust gap. AppFolio's research shows that when renters are satisfied with management, they are significantly less likely to move and far more likely to recommend, meaning reputation fuels both retention and referrals. A structured review process helps you document responsiveness and fairness. Request feedback after maintenance resolutions and at renewal, publish your service standards, and respond professionally to criticism with facts and improvements.
How do I reduce vacancy time without accepting unqualified applicants?
Focus on vacancy duration drivers: clarity, speed, and fit. HUD research emphasizes vacancy duration as a meaningful measure of market tightness and local variation. You reduce days vacant by improving listing conversion (better photos, clearer policies), showing-to-application speed (standardized steps), and renewal prevention through predictive rental management. Then keep screening consistent. Better positioning should increase qualified demand, not weaken standards.
Run a 7-Day Positioning Sprint
Pick one unit (or your next upcoming vacancy) and run a 7-day positioning sprint:
- Write your one-sentence value proposition (Step 1).
- Audit 10 local listings and choose one gap to own (Step 2).
- Add one high-impact proof point: laundry, internet readiness, pet clarity, smart comfort (Step 3).
- Publish your standards and start collecting landlord-tenant reviews to create visible accountability (Step 4).
- Refresh your listing so you can confidently list your rental with clear, honest differentiation (Step 6).
Most of competitive positioning is operational. The promise is whatever your photos and listing language say, but the proof is how rent gets collected, how maintenance requests get handled, and whether the renter can verify your reliability through a structured review system. That is exactly the gap Shuk fills for landlords running positioning playbooks like this one.
Shuk gives you online rent collection with automatic reminders, maintenance request tracking with photos and documents, centralized in-app messaging, two-way reviews where landlords and tenants rate each other quarterly throughout the lease (building a reusable rental reputation), and the Lease Indication Tool that polls tenants monthly starting six months before lease end so you get early renewal signals and can act on at-risk tenancies before they become vacancies. Year-Round Marketing keeps your listing current and ready to go live the moment you need it, so you never start from zero at vacancy. At $5 per unit per month with no setup fees, every Shuk subscription includes White Glove Onboarding at no additional cost.
Book a demo at shukrentals.com/book-a-demo to see how Shuk's rent collection, maintenance request tracking, in-app messaging, two-way reviews, the Lease Indication Tool, and Year-Round Marketing work together so the positioning you build on paper actually shows up in the renter's experience month after month.

Tenant Demand Forecasting: A Practical Playbook for Small Landlords
You know when your rentals are busy. Summer showings pick up. Inquiries slow around the holidays. Applications flood in when a major employer announces hiring. But instinct does not protect cash flow.
With national rental vacancy hovering around 7% (up from roughly 5.8% in 2022 to about 7.3% by early 2026), small missteps add up. Pricing slightly high. Listing a week late. Delaying renewal conversations. Each of these can quietly turn into weeks of lost rent. List-to-lease timelines have stretched too. Data providers report mid-30-day cycles in late 2024 and 2025.
That is why tenant demand forecasting matters. Done well, it helps you anticipate future rental availability, set rents with confidence, plan make-ready work, and run renewals like a system instead of a scramble.
This guide is built for self-managing landlords and property managers who want a practical, spreadsheet-friendly approach. No heavy jargon. No enterprise analytics tools required.
If you only do one thing after reading, build a 12-month lease expiration calendar and start tracking days-to-lease. Those two inputs alone will improve your marketing timing and renewal strategy.
Vacancy Risk Is Higher Than You Think
"Demand" is not just how many people want to rent somewhere. For landlords, demand is what shows up in your inbox and on your calendar. Inquiry volume, showing attendance, application starts, approvals, and most profitably, renewals. When you can forecast those patterns, you stop reacting and start planning.
Here is the challenge. The rental market is more competitive than many small operators assume. National rental vacancy has been in the high-6% to low-7% range recently, with notable regional variation. The South has posted higher vacancy readings than other regions.
Meanwhile, renters' shopping behavior is seasonal but shifting. Zillow reports peak rental hunting around June, with renters multiple times more likely to move during peak season. Apartment List has documented that traditional seasonality is flattening, and that peak rent growth has occurred earlier in the year in recent cycles, sometimes in March rather than later in spring. In other words, if you list "like you always have," you may miss the best window.
Add in longer leasing cycles (mid-30 days list-to-lease in late 2024 and 2025), and you get a painful reality. A unit that used to rent in two weeks might now sit a month, unless you price and market intentionally.
What This Costs in Real Money
Assume one unit rents for $1,900 per month. If demand softens and your vacancy stretches by just 18 extra days (roughly half of a 36-day lease-up window), that is about $1,140 in lost rent ($1,900 / 30 x 18), before utilities, turnover, and advertising.
Multiply that across 5 to 20 doors and you are looking at a meaningful dent in annual returns. Exactly why cash flow tracking for landlords must include vacancy loss, not just expenses.
Treat vacancy days like an expense line item. When you track it, you manage it.
What Tenant Demand Forecasting Actually Means
Tenant demand forecasting is the practice of using your own leasing and renewal history plus local market signals to estimate what will happen next. How quickly a unit will rent. What rent range the market will tolerate. What share of residents will renew.
For small landlords, forecasting is less about perfect predictions and more about better decisions, earlier.
At a practical level, your forecast answers five operational questions:
- When should I list? Timing, seasonality, and lead time.
- How should I price? Target rent versus time-to-lease tradeoff.
- What is my renewal plan? Lease renewal forecasting and retention levers.
- What weeks or months are risky? Periods where future rental availability outpaces demand.
- Where do I put effort? Better photos, faster make-ready, incentives, or tenant experience.
This matters now because the market has shifted from the rapid rent-growth environment of 2021 to 2022 (with some indexes peaking around 2022) to a slower-growth, more price-sensitive landscape in 2024 to 2026. NMHC has noted rent growth moderating versus the spike years and has framed recent gains in a longer-run context (multi-year averages rather than one-year surges).
When growth normalizes and vacancy rises, operations (speed, positioning, renewals) become the edge.
Finally, forecasting is not only about new leases. Retention is the hidden engine. RealPage reported renewal rates around the mid-50% range in 2024 for many multifamily cohorts, and large single-family operators have discussed renewal rent growth (not just new-lease growth) in their investor reporting. You do not need their scale to learn the lesson. Predictive lease renewal practices can be the lowest-cost way to stabilize occupancy.
Build two forecasts, not one: a lease-up forecast (days-to-lease + pricing), and a renewal forecast (who is likely to stay + what rent change is feasible).
Step-by-Step: How to Forecast Tenant Demand
Step 1: Define What "Demand" Means for Your Portfolio (Pick 6 to 8 Metrics)
Start with a simple definition. Demand is the rate at which qualified renters convert from views to inquiries to showings to applications to approved leases to renewals.
Choose a compact set of metrics you can track consistently:
- Days-to-lease (listing date to signed lease)
- Inquiry count per week, by channel if possible
- Showing-to-application conversion
- Application approval rate (screening fit)
- Effective rent (market rent minus concessions, useful when you offer incentives)
- Renewal offer acceptance rate (core for lease renewal forecasting)
- Turnover cost per move-out (cleaning, paint, lost rent)
- Vacancy loss (lost rent from vacancy days)
Why this works. Market vacancy rates are informative (national readings around 7% recently), but your micro-market is your property type, neighborhood, and price point. Your own data will reveal whether demand is a pricing problem, a marketing problem, or a product problem (condition, pet policy, parking, etc.).
Example
A duplex owner notices that one unit gets plenty of inquiries but low applications. Tracking showing-to-application conversion reveals a problem. The unit looks smaller in person than in photos. They rewrite the listing with accurate room dimensions and add a floor plan. Applications increase without lowering rent.
If you can only track three metrics, pick: days-to-lease, effective rent, and renewal acceptance rate.
Step 2: Build a Rent Roll + Lease Expiration Spreadsheet
You do not need a data warehouse. You need a spreadsheet that behaves like one. Use a rent-roll style sheet and add forecasting columns.
Minimum columns to include
- Property / unit
- Lease start date / lease end date
- Current rent / next renewal target
- Deposit, pet rent, utilities billed back
- Move-in source (referral, sign, online listing, etc.)
- Days-to-lease for the last turnover
- Renewal status (offered, accepted, declined)
- Tenant notes, kept factual and compliant with fair housing
Then add two calculated views
- 12-month lease expiration calendar (count leases ending each month).
- Rolling 12-month averages for days-to-lease and achieved rent (moving averages are easy to build in Excel or Sheets).
This makes future rental availability visible. When you see three leases ending in November and none in May, you can rebalance via renewal timing, early offers, or staggered lease terms when legal and appropriate.
Case scenario
A small manager with 18 units realizes 7 leases end between October and December. That is a demand trough in their market. They begin offering 13 to 15-month terms during summer move-ins to push expirations into spring. Over the next year, winter vacancy drops.
Add a "target new lease end month" column. Staggering is a forecasting tactic, not just a leasing detail.
Step 3: Map Your Seasonality and Adjust for the New Peak
Seasonality is real, but it is evolving. Zillow has reported peak rental hunting as June begins and notes that renters are far more likely to move in peak months. Apartment List has also highlighted that peak rent growth has shown up earlier in the year and that seasonality is less pronounced than it used to be.
What to do with that
- Chart inquiries, showings, applications, and signed leases by month for the last 24 to 36 months, even if you only have a few turns.
- Compare your months to what national reports suggest. High activity in late spring and early summer. Slower in late fall and winter.
- Treat seasonality as a timing advantage. List earlier for off-season move-outs, and be extra proactive on renewals for leases ending in slower months.
Example
A landlord in a college-adjacent neighborhood sees two demand spikes: May to August and December to January (students changing roommates mid-year). Their seasonality is not the national average. Forecasting works best when you respect your submarket's calendar.
For each unit, label it "seasonality-driven" (students, tourism, major employer) or "general market." Forecast them separately.
Step 4: Use Local Economic Signals to Explain Why Demand Changes
Small portfolios often miss one of the biggest forecasting levers: local leading indicators. Property management educators commonly advise tracking job growth, major employer announcements, university calendars, and building permits as demand drivers. You can gather much of this from public releases and local business news, then validate by watching your inquiry trends.
How to incorporate signals (simple scoring approach)
- Employment trend. Is the metro adding jobs or seeing layoffs?
- Supply trend. Are many new units delivering nearby? Permits and starts are good proxies.
- Mobility drivers. School year, military rotation cycles, hospital residency start dates.
- Affordability pressure. When rent growth slows and inflation cools, renters gain options. When rent growth is rapid, they compromise and apply faster.
Case scenario
A landlord near a logistics corridor sees inquiry volume jump after a new shift announcement. They respond by accelerating make-ready schedules and adding weekend showing blocks. Their days-to-lease falls despite broader market lease-up times lengthening.
Keep a one-page "market signals log." When a leasing month beats or misses your forecast, write the likely reason.
Step 5: Forecast Lease-Up Time Using Moving Averages and Market Reality Checks
In 2024 and 2025, multiple rental data sources observed longer time on market and list-to-lease periods. Mid-30 days in late 2024 and into late 2025. That does not mean your unit must take 34 to 36 days, but it does mean you should forecast with caution.
A simple method that works in spreadsheets
- Calculate each turnover's days-to-lease (list date to signed lease).
- Create a moving average (last 3 leases, last 5 leases) to smooth out one-off outliers.
- Add a seasonality adjustment. If your historical winter leases take 20% longer, apply that to your base forecast.
Then reality-check with market context. If vacancy is rising (nationally around the 7% band recently), your conservative scenario should assume longer lease-up unless your pricing is highly competitive.
Example
Last five leases averaged 24 days, but winter averaged 30. Your next vacancy is a November move-out, so you forecast 30 days, not 24. That changes your cash planning and your marketing start date immediately.
Start marketing earlier than your forecast by one week. Forecasting reduces surprises. It should not create them.
Step 6: Forecast Rent (and Decide When to Prioritize Speed Over Price)
Forecasting rent is not about guessing the highest possible number. It is about maximizing effective rent over time. In a slower-growth environment where national rents have been reported below prior peaks in some periods and rent growth has moderated compared to 2022, the best price is often the one that minimizes vacancy.
Use a two-scenario model
- Scenario A (price-first): higher asking rent, longer days-to-lease.
- Scenario B (occupancy-first): slightly lower asking rent, shorter days-to-lease.
Then compare annualized impact.
If rent is $2,000 and raising it to $2,070 adds 10 vacancy days, you lose about $667 ($2,000 / 30 x 10) to gain $70 per month. Break-even is about 9.5 months. If you expect a 12-month stay, it might work. If turnover risk is high, it might not.
Also track effective rent when you use concessions (one-time discounts, waived fees). Account for incentives rather than just face rent. This is critical for clean forecasting.
Case scenario
A fourplex owner offers a half-month concession in a slow month to cut vacancy by 20 days. Effective rent rises because the unit is occupied sooner, despite the concession.
Put vacancy days and concession cost on the same line in your forecast. They are both demand tools.
Step 7: Build a Renewal Forecast With a Simple Tenant Rating System
Renewals are demand you can influence. RealPage has reported renewal rates around 55% in 2024 cohorts, showing retention remains a major driver of occupancy. Large single-family operators also highlight renewal performance and renewal rent growth in their reporting. For small landlords, the playbook is simpler. Predict who is likely to renew, then act early.
Create a lightweight tenant rating system (objective and consistent)
Score each household 0 to 2 on each factor (total 0 to 10):
- On-time payment history (use your rent tracker)
- Maintenance cooperation and access
- Lease compliance (noise, unauthorized occupants, documented and not subjective)
- Communication responsiveness
- Length of stay trend (first-year vs. multi-year)
Then add renewal-friction flags
- Rent increase sensitivity (based on past negotiation)
- Life event indicators (asked about early termination, job change, if volunteered)
- Unit fit (growing family in a 1BR)
Your lease renewal prediction does not need to be perfect. It needs to separate "likely yes," "maybe," and "at risk."
Example
Tenant A scores 9 out of 10, always pays on time, fixed-term job locally. Offer renewal 90 days early with a modest increase. Tenant B scores 5 out of 10, late twice, asked about month-to-month. Start a retention conversation early, or plan marketing sooner.
Renewal forecasting is not just numbers. It is timing. Start your renewal workflow 75 to 120 days before lease end.
Step 8: Reforecast Quarterly and Turn Insights Into an Action Plan
Forecasting is a cycle. IREM training materials emphasize the importance of reforecasting and periodic budget resets as conditions change. For small portfolios, a quarterly cadence is realistic.
- Monthly: update occupancy, upcoming expirations, inquiry counts, days-to-lease.
- Quarterly: reforecast rent, renewal rates, and vacancy loss. Adjust marketing and make-ready timelines.
- Annually: rebalance lease expirations and review screening criteria for conversion outcomes.
Turn your forecast into a "this quarter" plan
- If Q4 is slow: push renewals earlier, reduce expirations, list earlier, refresh photos.
- If spring is hot: schedule turns to hit May and June. Consider slightly higher rents. Prioritize fast showings.
- If lease-up time is rising in your area: tighten operations. Vendor scheduling, self-showing windows, faster application decisions within compliance.
Case scenario
A manager sees their rolling average days-to-lease rising from 21 to 29. They respond by improving listing quality and expanding showing windows. Next quarter returns to 23 days.
A forecast without a calendar is just a report. Put tasks on dates: renewal offers, listing launch, make-ready start.
Tenant Demand Forecasting Checklist
Use this as an inline template or copy it into a spreadsheet. If you maintain it weekly, you will have enough data to do meaningful tenant demand forecasting within 60 to 90 days.
A) Set Up Your Tracking (One-Time Setup)
- Create a rent roll with: unit, lease start and end, rent, fees, deposit
- Add columns: list date, signed date, days-to-lease
- Add renewal columns: offer date, offered rent, accepted (Y or N), decision date
- Add a "source" column for each move-in (referral, sign, listing, etc.)
- Create a 12-month lease expiration calendar (count leases ending per month)
B) Weekly Leasing Pulse (10 Minutes)
- Number of inquiries this week
- Number of showings completed
- Number of applications started and completed
- Notes on what prospects mention (price, pets, parking, commute)
C) Monthly Forecast Update (30 Minutes)
- Update rolling average days-to-lease (3 and 5-lease moving averages)
- Calculate vacancy loss per unit (vacant days x daily rent)
- Recheck seasonality assumptions (your history vs. national peak activity)
- Update a market signals log (job changes, new supply, university calendar)
D) Renewal Workflow (Every Month)
- Identify leases ending in 90 to 120 days
- Assign each tenant a score (0 to 10) using your tenant rating system
- Set a renewal plan: early offer, standard offer, or prepare to market
- Track acceptance rate (core rental renewal analytics)
Simple Spreadsheet Tabs (Recommended)
- Rent Roll (master list)
- Leasing Funnel (weekly inquiries, showings, apps)
- Turnover Log (dates, costs, days-to-lease)
- Renewal Tracker (offers, results)
- Dashboard (charts: expirations by month, rolling days-to-lease)
If you do not want to build from scratch, start from any rent-roll or landlord spreadsheet structure and add just two modules: a turnover log and a renewal tracker.
FAQ
How far ahead should I forecast tenant demand?
For small portfolios, use three horizons: 30 days, 90 days, and 12 months. The 30-day view helps you staff showings and finish make-ready work. The 90-day view drives renewal offers and marketing start dates. The 12-month view is where you manage future rental availability by spotting clusters of lease expirations. If list-to-lease is stretching toward a month in some markets, a 30 to 45-day pre-listing runway becomes far more important than it was when units rented in two weeks.
What is the biggest mistake landlords make with tenant demand forecasting?
Misreading seasonality, or assuming last year's seasonality will repeat exactly. Zillow points to June as a peak time for rental hunting, while Apartment List notes that seasonality is flattening and peak rent growth has shown up earlier in the year in some cycles. If you wait to list until the classic peak window, you might be late. Track your own inquiries and lease signings by month and use a rolling average approach to smooth anomalies. Forecasting is local first, national second.
How do I predict renewals without big data?
Use predictive lease renewal signals you already have: payment history, communication patterns, maintenance behavior, and lease compliance. Then apply a consistent tenant rating system to segment households into likely renew, uncertain, and likely move. Pair that with an early renewal cadence. Many operators emphasize renewals as a major occupancy driver. RealPage has cited renewal rates around the mid-50% range in 2024 cohorts. The heart of lease renewal forecasting is not perfect prediction. It is earlier action.
Should I lower rent if demand is slow?
Not automatically. First, look at the math. A small rent cut that saves vacancy days can increase annual effective rent. Second, consider concessions and track effective rent, which accounts for incentives rather than just the advertised number. Third, validate with your funnel. If inquiries are strong but applications are weak, pricing might not be the problem. Listing quality, showing availability, or screening friction might be. Use your days-to-lease moving average and compare to broader market lease-up conditions.
Turn Forecasting Into Action
If you want to find tenants year-round, do not start by trying to predict the whole market. Start by predicting your own next 90 days, then tighten your process every quarter.
Do this today (30 minutes):
- Open your rent roll and add lease end dates for every unit.
- Create a simple "leases ending by month" count for the next 12 months.
- Add a turnover log with list date, signed date, and days-to-lease.
Then set a recurring calendar reminder to reforecast quarterly. Update your moving averages, review your renewal acceptance rate, and adjust pricing and marketing based on what your funnel is telling you.
The hardest part of tenant demand forecasting is not the math. It is renewal forecasting. Predicting which tenants will stay and which are likely to leave, far enough ahead to actually do something about it. That is the gap most small landlord spreadsheets cannot close, because the signals (payment history, communication patterns, maintenance behavior) are scattered across apps, texts, and emails.
This is where the Lease Indication Tool, our predictive lease renewal capability, comes in. Shuk's LIT sends digital monthly polls starting six months before lease end, asking tenants on a five-point scale (very likely, likely, not sure, unlikely, very unlikely) whether they plan to renew. You get early renewal intelligence directly from the people who decide whether to stay, integrated with the same platform that already centralizes rent payment history, in-app messaging, and maintenance request tracking. Your 0-to-10 tenant rating system gets sharper because the signals live in one place.
Book a demo at shukrentals.com/book-a-demo to see how Shuk's Lease Indication Tool, rent collection with payment history tracking, in-app messaging, and maintenance request tracking work together so the next time you build a renewal forecast, the data is in one place and the early signals are already in your hands.

Reduce Vacancy Risk Through Smarter Marketing
The Real Cost of Empty Units
Vacancy is not just lost rent. It is a compounding drain on NOI that you will never recover. Every empty day costs you revenue plus the operational friction of showings, utilities you are covering, vendor scheduling, and time spent chasing leads that never convert.
Nationally, the U.S. rental vacancy rate has been hovering in the mid to upper single digits in recent quarters. That is a meaningful headwind if you are self-managing and competing against professionally marketed inventory. And the market shifts fast. Supply, seasonality, affordability pressures, and renter behavior change constantly, which means "list it when it is empty" is no longer a safe plan.
Here is the good news. Vacancy is one of the most controllable levers you have, if you treat marketing like an ongoing pipeline instead of a last-minute scramble. The same modern tactics that improve lead volume and lead quality (broad listing distribution, strong creative, rapid response, and automated follow-up) also shorten days vacant and reduce the risk of a stale listing that sits while you keep dropping price.
Consider what renters actually do today. They shop online first, compare options quickly, and expect fast answers. Large rental networks now reach massive audiences. Zillow reports 30 million renters monthly in 2024, and Apartments.com reports roughly 44 million monthly unique visitors. If your unit is not consistently visible, or your response speed is slow, your vacancy is effectively self-inflicted.
How marketing drives vacancy outcomes in practice:
- A well-distributed listing reaches renters where they already search, which can reduce dead time waiting for inquiries.
- Listings with 3D tours can generate dramatically more leads. Apartments.com cites 23 times more leads for listings with 3D tours.
- Better media changes the speed-to-lease curve. Zillow has reported 3D Home tours get 68% more views and homes sell about 10% faster (sales data, but the visibility and decision-speed effect translates to rentals).
Two takeaways:
- Start measuring vacancy like a pipeline problem, not a maintenance problem.
- Your marketing system should begin before notice is given, accelerate during the turn, and continue after lease signing to support retention.
Continuous Marketing Reduces Vacancy
Reducing vacancy through marketing is a simple idea with disciplined execution. Keep future availability visible. Attract the right prospects. Respond quickly. Retain good tenants so you do not have to re-fill as often.
For independent landlords and property managers, the most reliable approach is continuous rental marketing. An always-on process that builds demand even when you do not have an immediate opening. That does not mean spamming ads year-round. It means maintaining a clean digital presence, publishing predictable future-availability signals, and using automation so you are not doing everything manually.
This guide provides a step-by-step workflow connecting modern tactics directly to vacancy reduction, including:
- Listing visibility across the places renters actually search
- Creative optimization (headlines, photo count, descriptions, 3D tours, video) that increases clicks and qualified inquiries
- Operational speed (fast follow-up, scheduling, central inbox messaging) to prevent lead decay
- Proactive renewal outreach and lease end management that reduces turnover, supported by predictive signals
- Reputation and transparency that improve conversion, especially when renters compare similar listings
Throughout, you will see concrete examples, mini case studies, and checklists you can run with a small team or solo. The unifying theme is leverage. The smartest systems reduce vacancy by doing three things at once:
- Increasing the number of qualified leads (volume)
- Shortening the time from inquiry to showing to application to approval (speed)
- Reducing the number of times you must re-market (retention)
Examples of always-on visibility that reduces vacancy risk:
- Keeping a "next available" or waitlist signal alongside your listings, even when full, so you can pre-fill a pipeline
- Publishing simple neighborhood content to support SEO and long-tail search discovery
- Maintaining consistent listing quality and media standards so every unit launches market-ready on day one
Two takeaways:
- Do not judge marketing by likes or even inquiries alone. Judge it by days vacant and lead-to-lease cycle time.
- Those are the metrics that hit NOI.
Step-by-Step Workflow to Reduce Vacancy
Step 1: Treat Vacancy Like a Funnel and Track the Right Metrics
Most vacancy mysteries are measurement problems. If you only track whether the unit is vacant, you miss the leading indicators that tell you why it is vacant. Low views, low inquiry rate, slow response, poor showing-to-application conversion, or weak renewal rates.
Start with a basic funnel and attach targets:
- Impressions and views (are people seeing it?)
- Inquiries (is the listing compelling?)
- Showings scheduled (is your response fast and the process easy?)
- Applications started and completed (is screening friction too high or unclear?)
- Approved and deposit paid (are you losing prospects to faster operators?)
Use listing network reach as context. If a platform reaches tens of millions of renters monthly, your performance depends on your listing competitiveness and speed, not "market demand" alone. Also pay attention to seasonality. Zillow notes renter activity spikes during peak months, like early summer, which affects lead volume and how early you should launch listings. When you know your seasonal curve, you can adjust launch timing and pricing proactively.
Mini case study #1
Sarah, a 12-door landlord, realized her units were not hard to rent. Her workflow was slow. She began tracking response time and showing conversion. By switching to a simple funnel dashboard and setting a rule that every inquiry gets a reply within one business hour, she reduced her average vacancy by 18 days over two turns. The biggest change was not price. It was speed plus clearer screening criteria upfront.
Examples of funnel-based fixes
- Lots of views but few inquiries: headline, photos, or price positioning issue.
- Lots of inquiries but few showings: slow response or scheduling friction.
- Lots of showings but few applications: mismatch between ad promise and reality. Improve accuracy and transparency.
Two takeaways:
- Set two non-negotiable service-level targets: inquiry response time and time from completed application to decision.
- Faster decisions reduce vacancy more reliably than small rent discounts.
Step 2: Build a Market Position Renters Can Understand in 10 Seconds
Renters do not buy your unit. They buy the story. Location, lifestyle, reliability, and clarity. Your brand as a small operator is often your advantage. Responsive service, clean units, transparent requirements, and a frictionless process. Make that positioning explicit in every listing and in your digital touchpoints.
Start with a simple positioning statement:
- "Updated, well-maintained homes with fast maintenance response and clear screening criteria."
- "Quiet buildings, professional communication, and easy online rent and repairs."
Then translate it into your listing content standards:
- Headline formula: start with price, then beds and baths, then an irresistible feature.
- Description structure: upgrades, amenities, requirements, and neighborhood highlights.
- Transparency: list key requirements clearly (income multiple, credit minimum if used, pet policy, fees) to reduce unqualified inquiries and speed approvals.
Examples of positioning that reduces vacancy
- Instead of "Nice 2BR," use: "$1,895 | 2BR/1BA | In-unit laundry + off-street parking" (price + basics + differentiator).
- Add a "What it is like to live here" section: noise level, parking reality, commute options.
- Include a "How to apply" block with steps and expected decision timeline.
Mini case study #2
A property manager overseeing 48 units standardized headlines and added a "Lease timeline" section to every ad. Inquiries became more qualified, and showing cancellations dropped. The team reported fewer back-and-forth questions because requirements were clearer upfront, creating a measurable drop in days vacant during winter leasing, when demand is typically softer.
Two takeaways:
- Positioning is not decoration. Clear, consistent messaging reduces vacancy by filtering out mismatches early.
- It also increases confidence for qualified renters to apply quickly.
Step 3: Win the Listing Page With Media: Photos, 3D Tours, and Video
Renters decide whether to inquire in seconds. Your media does the heavy lifting. The research is clear: interactive media increases engagement and lead volume. Apartments.com reports listings with 3D tours get 23 times more leads than those without. Zillow has also reported that 3D Home tours earn 68% more views and homes sell faster (sales-focused, but it signals how strongly tours influence decision-making).
Photo standards matter too. Zillow's guidance suggests an ideal range of 22 to 27 photos for stronger listing performance. In practical terms, this prevents the two common failure modes:
- Too few photos: renter uncertainty leads to fewer inquiries.
- Too many low-quality photos: clutter and distrust.
Photo best practices (operationally realistic)
- Shoot in daylight, lights on, blinds open.
- Lead with the hero image (bright living room or exterior).
- Include context shots: kitchen flow, storage, parking, entryway.
- Avoid misleading angles. Renters punish surprises with no-shows.
Examples of media upgrades that reduce vacancy
- Add a simple 3D tour for every turn. Use it to pre-qualify prospects who have not physically visited yet.
- Record a 60 to 90-second walkthrough video that matches the actual layout and calls out key features.
- Re-order photos so the first five images tell the full story.
Two takeaways:
- If you can only do one upgrade, do a 3D tour.
- The lead lift can offset the cost quickly because vacancy days are often more expensive than media.
Step 4: Publish Where Renters Search and Keep Future Availability Visible
A great listing that no one sees is still a vacancy. Wide listing distribution is the simplest way to expand exposure without multiplying your workload. The key is to use a workflow that pushes one high-quality listing to multiple networks and keeps it updated.
Zillow's rentals network reach (30 million renters monthly) shows how big the funnel is when you publish where renters actually browse. Apartments.com's network traffic is also massive at roughly 44 million monthly unique visitors. You do not need more marketing ideas as much as you need consistent distribution.
Distribution also supports continuous rental marketing. Even when you are fully occupied, you can:
- Maintain a "coming soon" cadence based on known lease-end dates, with tenant consent and fair housing compliance.
- Capture leads for future rental availability through a waitlist.
- Re-market your brand reputation so the next vacancy fills faster.
Practical distribution rules
- One canonical listing source (your site or platform) plus consistent data fields.
- Refresh listing content when it has been live 7 to 10 days without traction (new lead photo, tighten headline, add tour).
- Post timing: guidance often suggests midweek posting performs well (Tuesday through Thursday).
Examples
- A duplex operator publishes a single high-quality listing pushed to major portals. Inquiries double compared with single-site posting.
- A manager keeps "coming soon in 30 to 45 days" listings ready to activate immediately after notice, reducing downtime between turns.
- A portfolio adds a "join our next-available list" link in every listing description to keep a warm pipeline.
Two takeaways:
- Distribution reduces vacancy only when your data stays current.
- Use software and workflows that prevent outdated availability, incorrect pricing, or missing media. Those errors directly increase days vacant.
Step 5: Respond Faster With a Centralized Messaging Mindset (SMS, Email, Automation)
Speed is a vacancy strategy. Online leads decay quickly. If you respond hours later, many prospects have already booked another showing. This is where a centralized messaging approach (one inbox, templates, automation, and logging) outperforms scattered texts, personal email, and missed calls.
Build a simple communication stack
- Auto-reply confirming receipt and next step ("Answer these 3 questions to schedule").
- Templates for FAQs (pet policy, income requirements, move-in costs, showing windows).
- Follow-up drip for non-responsive leads (email or SMS).
- Central log for compliance and continuity.
Also, keep the process digitally complete. Online scheduling, online applications, and clear screening steps. This pairs naturally with lease management software because the same platform can carry the renter from inquiry to application to lease signing without handoffs.
Examples of vacancy-reducing automations
- Showing confirmation and day-of reminder texts reduce no-shows.
- A 3-message drip over 72 hours for leads who inquired but did not schedule.
- An application nudge ("You are 70% complete. Upload pay stubs here.") to increase completion rate.
Two takeaways:
- Create two response templates today: first reply to inquiry, and showing invitation with screening pre-questions.
- If you do nothing else, you will reduce lost leads and shorten time-to-lease.
Step 6: Proactive Renewals and Lease End Management
The cheapest vacancy is the one you never create. Retention is marketing because it preserves occupancy without re-acquisition costs. Yet many small operators treat renewals as an administrative afterthought. Modern practice is lease end management: proactive outreach, clear options, and early identification of likely move-outs.
Start renewal work 90 to 120 days before lease end
- Confirm tenant intent (renew, month-to-month, or vacate).
- Share renewal offer with deadline and clear rent terms.
- Offer easy digital acceptance and e-signature.
- If they are likely to leave, start pre-marketing future availability and line up vendors.
Emerging tools add predictive signals to this process: late payments, maintenance volume changes, communication sentiment, prior renewal behavior. Even simple rules in a spreadsheet help. If a tenant has asked about move-out procedures, requested multiple repairs, or had repeated payment friction, treat that lease as at-risk and start earlier.
Examples of renewal outreach that reduces vacancy
- Offer a renewal with a clear "good, better, best" term menu (12 months, 18 months, 24 months).
- Send a "renewal preview" 120 days out so tenants can budget.
- If non-renewal is likely, schedule pre-move-out inspections early and pre-book cleaners and paint.
Two takeaways:
- Put renewal touches on a calendar or automate them.
- A consistent renewal cadence can reduce vacancy more than any single advertising tactic because it reduces turnover volume.
Step 7: Reputation and Transparency Convert More of the Leads You Already Have
When renters compare similar units, trust wins. Renters read reviews, ask friends, and judge your responsiveness during the inquiry stage. You cannot ad-spend your way out of low trust. You need a system for transparency: collecting honest feedback, responding professionally, and ensuring your listings match reality.
Digital leasing trends indicate renters value a modern, transparent process. That transparency shows up in:
- Accurate photos with no bait-and-switch.
- Clear fees and requirements.
- Professional messaging and documented follow-through (maintenance updates, deposit accounting).
Examples of reputation actions that reduce vacancy
- After a successful maintenance resolution, ask for a short review.
- Publish your process: typical maintenance response times, how showings work, what you will need to apply.
- Respond to negative feedback with facts and a calm tone. Future renters read your response more than the complaint.
Two takeaways:
- Add one trust element to every listing: a "what to expect" block or a short FAQ.
- Trust increases application confidence and reduces time wasted on uncertain prospects.
Run Marketing Like a System: An Operational Checklist
Use this template to run marketing like a system. Copy and paste into your task manager and assign owners and dates.
Pre-Listing (30 to 60 Days Before Availability)
Goal: Build pipeline before the unit is empty.
- Confirm likely availability window (lease end date plus expected turn time).
- Draft "coming soon" listing with placeholder date, only if compliant and accurate.
- Refresh neighborhood highlights and commute points.
- Prepare screening criteria and publish clearly (income, credit, pets, fees).
- Set renewal outreach schedule (120, 90, 60, 30-day touches).
Examples
- A single-family rental: start "coming soon" 45 days out and begin waitlist capture.
- Small multifamily: stage one model unit's photos and reuse for identical floorplans.
If you wait until keys are returned, you have accepted avoidable vacancy.
Active Listing (0 to 21 Days Live)
Goal: Maximum exposure plus fast conversion.
- Distribute to major networks. Ensure consistent data fields.
- Headline format: price + beds and baths + standout feature.
- Upload 22 to 27 high-quality photos.
- Add a 3D tour (priority) and a short walkthrough video if possible.
- Enable rapid lead response: templates, auto-replies, scheduling link.
- Drip follow-up at 24 hours, 48 hours, 72 hours for unbooked inquiries.
- Refresh after 7 to 10 days if performance is weak (swap hero photo, tighten copy, verify price).
Examples
- If you have views but low inquiries, rewrite headline and lead photo first.
- If you have inquiries but low showings, fix response time and scheduling friction.
Track your inquiry-to-showing ratio weekly. It is the fastest diagnostic for messaging and response issues.
Post-Lease (Move-In Through Renewal)
Goal: Reduce future vacancy by retaining good tenants.
- Digital welcome packet plus a clear maintenance request channel.
- 30-day check-in to catch small issues before they become move-out reasons.
- 120 and 90-day renewal sequence with clear options.
- If non-renewal: launch pre-marketing, schedule vendors, and plan a fast turn.
Examples
- A proactive maintenance touch reduces frustration that often triggers non-renewal.
- An early renewal offer avoids the last-minute surprise that pushes tenants to shop elsewhere.
Retention is a marketing KPI. Put renewals on the same dashboard as leads and showings.
FAQ
How early should I list a rental to reduce vacancy?
If you know a likely availability date, start building visibility 30 to 60 days ahead. Use accurate "coming soon" messaging and capture leads for future availability. Market timing matters. Zillow notes renter activity spikes during peak rental season, so earlier visibility helps you ride demand waves instead of reacting to them. Earlier visibility also gives you time to refresh photos and copy if early performance is weak.
Do 3D tours and video really help, or are they optional?
They materially help. Apartments.com reports 23 times more leads for listings with 3D tours. Zillow has reported 68% more views for 3D Home tours. Even if your market is smaller, tours reduce uncertainty and help prospects self-qualify faster, which means fewer wasted showings and a higher inquiry-to-application conversion rate. The lead lift typically offsets the cost of producing the tour quickly.
What is the most efficient way to market multiple units without burning out?
Standardize your creative (headline formula, photo checklist, description blocks) and use distribution plus automation. A single source-of-truth listing and a central message inbox reduce errors and speed response. Two of the biggest drivers of vacancy. Posting midweek can also improve engagement consistency. Standardization is what makes multi-unit marketing sustainable when you are running a small team or working solo.
How do I reduce vacancy in the slow season (fall and winter)?
Lean harder into media quality (photos plus tour), faster follow-up, and proactive renewals so fewer units hit the market during low demand. Zillow publishes guidance on finding renters in fall and winter. Expect lower volume and plan earlier with a longer runway and stronger listing presentation. Defending occupancy through renewals matters more in slow seasons than in peak, because re-leasing risk is higher when overall demand is thinner.
Reduce Vacancy Starting Today
If you want the fastest path to fewer vacancy days, implement this in two moves.
First, adopt year-round visibility. Keep a lightweight continuous marketing engine running. Listings published when needed, "coming soon" preparation, and a waitlist for future availability. The unit you list next month should never start from scratch.
Second, consolidate operations into one workflow. When marketing, leasing, messaging, applications, lease signing, and renewal automation live in one connected system, you reduce dropped leads, shorten decision times, and improve lease end management.
This is exactly where Shuk's Year-Round Marketing differentiator comes in. Most rental software treats marketing as something you turn on at vacancy. Shuk keeps your listing current and ready to go live the moment you need it, so you never lose time rebuilding from scratch when a tenant gives notice. Your listing stays prepared, your media stays organized, and your pipeline stays warm.
Combined with Shuk's centralized in-app messaging with email and push notifications, e-signature for leases through our Adobe-powered integration, tenant screening via our screening partner, and the Lease Indication Tool that polls tenants monthly starting six months before lease end so you get early signals on renewal likelihood, the operational picture changes. Marketing stops being a scramble and becomes a system.
Book a demo at shukrentals.com/book-a-demo to see how Shuk's Year-Round Marketing, in-app messaging, e-signature for leases, tenant screening, and the Lease Indication Tool work together so the next time a unit comes available, your listing is ready, your pipeline is warm, and your days vacant are shorter.

Rental Market Trends: A Landlord's Playbook for 2024 to 2026
What's Actually Happening (and Why It Matters to Your Property)
"Rental market trends" sounds like something only institutional investors track. But for independent landlords and property managers, these trends show up as real operational problems. Units sitting vacant longer. Applicants who cannot clear income checks. Competing buildings offering six weeks free. Or a renewal season that feels weaker than last year.
Nationally, the market has moved from the rapid rent growth of 2021 to 2022 into what is best described as a late-cycle pause. Headline rent numbers barely move, while local conditions swing widely.
Widely followed indices show rent growth near flat. Yardi Matrix reported average U.S. advertised multifamily rent at $1,750 in March 2026, up just 0.1% year-over-year. Redfin's median asking rent across major metros was $1,625 in April 2026, down 1.0% year-over-year. Zillow's Observed Rent Index (ZORI), which reflects changes on occupied units, showed $1,910 typical rent in March 2026, up 1.8% year-over-year. The "right" number depends on what you own, where you own it, and whether you are looking at asking rents or in-place rents.
Vacancy is creeping up. The Census Housing Vacancy Survey shows the national rental vacancy rate rising from 7.1% in Q1 2025 to 7.3% in Q1 2026. CoStar / Apartments.com raised its multifamily vacancy forecast to 8.8% by year-end 2026, driven by heavy deliveries in certain metros and slower absorption in the top-of-market segment.
Here is the practical challenge. If you price like it is 2022, you may buy vacancy. If you discount like it is a recession everywhere, you may give away NOI in submarkets that are still tight.
This guide breaks down current rental market conditions, the supply-demand mechanics behind rent changes, and most importantly, how to track and interpret market data yourself so you can make compliant, defensible pricing and investment decisions.
Two takeaways before we go deeper:
- Treat national headlines as context, not a pricing tool. Your comp set and submarket supply pipeline matter more than the national average.
- Build a simple monthly market dashboard so you are reacting to leading indicators (vacancy, permits, concessions), not lagging ones (annual rent reports).
What's Driving Rental Market Conditions Right Now
Across 2024 to 2026, the U.S. rental market is best described as two markets at once. A national slowdown in advertised rent growth, and sharp local divergence driven by construction pipelines, migration, and regulatory risk.
Rent growth has flattened nationally by most measures
Multiple reputable providers show low single-digit or negative asking-rent growth:
- Yardi Matrix: multifamily advertised rents up 0.6% year-over-year in December 2024, up 1.0% in March 2025, up 0.1% in March 2026.
- Redfin: median asking rent down 1.0% year-over-year in April 2026.
- Zillow ZORI: typical rent up 1.8% year-over-year in March 2026.
These do not conflict as much as they appear. Zillow's measure tends to capture in-place rent movement, while Yardi and Redfin skew toward new asking rents and leasing margins, where concessions and competitive pricing hit first.
Vacancy is rising, especially in Class A, and that pressure is uneven
Census puts the overall rental vacancy rate at 7.3% in Q1 2026. Professional multifamily occupancy remains relatively high in stabilized properties. Yardi shows about 94.4% occupancy in February 2026. But market analytics firms see more softness as new supply delivers. Cushman and Wakefield reported Class A vacancy at 10.3% versus 7.4% for Class B and C in Q3 2025. That flight to value matters for small landlords. Well-maintained B and C units can hold demand while luxury lease-ups chase residents with incentives.
Supply is the swing factor and the pipeline is turning
Deliveries were heavy. Harvard's Joint Center for Housing Studies (JCHS) reports 608,000 multifamily completions in 2025. But starts are down from the peak. Census multifamily starts were 470,000 (seasonally adjusted annual rate) in March 2026 versus a 2022 peak near 708,000. Industry outlooks highlight a "supply cliff" forming after 2026 as financing and feasibility constrain new projects. For operators, that suggests a near-term leasing fight in oversupplied metros, but potentially firmer rent conditions later.
The macro backdrop: easing shelter inflation, high mortgage rates, steady employment
Shelter CPI has decelerated from 6.2% in mid-2024 to 4.6% in March 2026. Zillow expects further cooling in 2026 for OER and Rent of Primary Residence. Mortgage rates remain high (Redfin outlook around 6.3% in 2026), keeping some households renting longer. Unemployment has edged up but remains moderate (4.2% in April 2026). Net effect: demand is steady, but affordability constraints limit pricing power.
Three metros, three realities
- Phoenix: rents soft with elevated vacancy. Kidder Mathews shows 12.6% vacancy in Q4 2025 and modest rent declines.
- Austin: still digesting a wave of new apartments. Cushman and Wakefield noted 10.6% stabilized vacancy in Q4 2025 and rent declines.
- New York City: exceptionally tight. Matthews reports 3.4% vacancy in Q3 2025 and strong rent growth in many segments.
Two takeaways:
- Assume 2026 rent growth is modest nationally (around 0% to 2%), but underwrite your local rent path from vacancy and supply data, not a national forecast.
- Watch Class A concessions. They are a leading indicator that can pull residents from your comp set without any "market crash."
How to Track, Interpret, and Forecast Rental Market Trends
Step 1: Build your rental market data stack and know what each metric really measures
To track rental market trends in a way that improves decisions, start by separating asking rents, effective rents, and in-place rents.
- Asking rent: what listings advertise today. This is where you see competition and concessions first. Providers like Yardi Matrix and Redfin focus heavily here.
- Effective rent: asking rent minus concessions (free weeks, gift cards, waived fees). Many "flat rent" headlines hide effective declines when incentives rise. Zillow noted incentives peaking seasonally, including a resurgence in early 2025.
- In-place rent: what current tenants are paying. This drives your actual revenue. Zillow's ZORI, based on observed rents, often moves differently than asking-rent series.
What to collect (minimum viable set):
- Your comps' asking rents and availability (weekly snapshot)
- Days-on-market and inquiry volume from your listing platform or PM software
- Concession prevalence in your submarket (manual scan of 20 to 40 listings)
- Vacancy and new deliveries (quarterly from market reports, monthly if available)
Examples from the field
The headline-index trap. A duplex owner sees Zillow ZORI up 1.8% year-over-year nationally and raises rent 5% at renewal. But local Class A buildings are at 10%+ vacancy (common in many supply-heavy metros per Cushman and Wakefield's national segmentation), offering 6 to 8 weeks free. Result: tenant shops and leaves, and the landlord loses two months of rent. The fix is not "never raise rent." It is aligning rent moves with the comp set's effective rent.
SFR operator uses an SFR-specific index. Yardi's single-family rental index showed $2,148 in January 2026, up 0.3% year-over-year nationally. If you manage scattered-site homes, benchmark to SFR measures and local MLS rent comps, not just apartment indices.
Two takeaways
- Pick one asking-rent benchmark and one in-place benchmark, then track both consistently so you can tell whether a "rent drop" is a leasing-margin issue or a true revenue issue.
- Always write down which rent you are comparing: asking vs. effective vs. in-place. Mixing them creates bad forecasts.
Step 2: Read supply like a landlord. Permits, starts, deliveries, and the shadow comp set
In 2024 to 2026, supply is the biggest driver of divergence in local rental market trends. Nationally, completions were high (JCHS: 608,000 multifamily completions in 2025), while starts fell sharply (Census: 470,000 seasonally adjusted annual rate in March 2026). That combination produces a common pattern. Near-term softness where buildings are delivering, followed by tightening later as fewer new projects start.
Landlords should monitor four layers of supply:
- Units under construction (pipeline pressure). Industry commentary noted under-construction counts falling toward 2026.
- Completions and deliveries (what actually hits leasing).
- Lease-up velocity (how quickly new supply absorbs).
- Shadow supply. Condo rentals, ADUs, and single-family built-for-rent starts. NAHB reported 68,000 BTR starts in 2025, down 19% year-over-year.
Examples from the field
Phoenix: oversupply shows up as vacancy, then rent cuts. Phoenix saw heavy deliveries (25,000 in 2024, 14,000 in 2025) with vacancy rising (Kidder Mathews: 12.6% in Q4 2025). A small landlord competing against new mid-rise product may need to defend occupancy with targeted improvements or tactical concessions, while avoiding permanent rent reductions that reset comps.
Austin: pipeline as a percentage of stock matters. Austin's pipeline has been notably large. Yardi reported pipeline intensity at 7.8% of stock in one 2026 snapshot. When pipeline is high relative to existing inventory, expect longer leasing times and aggressive specials in nearby lease-ups.
NYC: supply constrained by policy and tax incentives. NYC's construction outlook has been shaped by the expiration of 421-a and uncertainty around replacements, with reports indicating many planned starts stalled. Even with some office-to-residential reforms (City of Yes), the near-term supply constraint supports tighter vacancy.
Two takeaways
- Track deliveries within a 1 to 3-mile radius of your property, not just metro totals. Your rent is set by your micro-market, not the MSA average.
- When you see a lease-up delivering, forecast concessions first, then decide whether to compete on price, terms (longer lease), or product (unit upgrades).
Step 3: Model demand using household math and affordability, then stress-test your rent plan
Demand is not one variable. It is the outcome of household formation, migration, job growth, and affordability.
Nationally, household formation was strong in 2024 (1.27 million net new households) and slowed in 2025 (0.9 million) as conditions normalized. Migration patterns show meaningful shifts toward lower-tax or faster-growth regions. Meanwhile, affordability remains a constraint. Redfin estimated homebuyers pay meaningfully more than renters, a gap that narrowed but still keeps many households renting. Renters' incomes also matter. Zillow's consumer housing trends profile provides a baseline renter median income around $51,300, reinforcing that rent increases must fit local wage realities.
How to operationalize demand signals:
- Employment and unemployment. Rising unemployment usually leads demand softening with a lag. BLS unemployment was 4.2% in April 2026.
- Rent-to-income. When your target tenant cohort is above roughly 30% rent-to-income, renewal risk rises and delinquency risk can increase.
- Migration and household formation. Inflow metros can stay tight even when national rent growth is flat.
Examples from the field
Phoenix: strong in-migration, but supply wins in the short run. Phoenix has attracted migrants (IRS migration data shows positive net migration in recent years), but heavy apartment supply can still depress asking rents. A landlord can recognize that "demand is good" does not always mean "rents go up" if deliveries outrun absorption.
Austin: job growth supports demand, but absorption must catch up. Austin added jobs in 2025 per local economic reporting, yet vacancy rose due to record deliveries. For a landlord, that suggests demand is present but price sensitivity increases, and lease-up competition becomes intense.
NYC: international inflow and constrained supply create tight conditions. NYC posted population growth in the city's planning estimates (first positive since the pandemic era in that report), while vacancy metrics remain low. A small building can often push renewals more than national headlines imply, while still staying compliant with rent-stabilization rules where applicable.
Two takeaways
- Build a simple demand "score" each quarter: job trend + migration narrative + rent-to-income + school calendar / seasonality. You do not need a PhD. You need consistency.
- Stress-test renewals. If your submarket is concession-heavy, assume higher move-outs unless you offer a competitive renewal package.
Step 4: Forecast rent growth with a landlord-grade approach. Scenarios, not single-number predictions
Most forecast providers project modest national growth. Freddie Mac has cited around 1.2% multifamily rent growth for 2026, while Yardi's outlook has been near flat for 2026. CoStar expects vacancy to peak later, implying rent recovery may lag. Those ranges are not contradictions. They are reminders to forecast by scenario.
A practical 3-scenario framework
- Base case (most likely): rent growth 0% to 2% over the next 12 months, moderate vacancy drift. Aligns with the consensus of low growth across Yardi, Zillow, and Redfin.
- Soft case: effective rents down due to rising concessions, occupancy pressure if new deliveries are concentrated nearby. Supported by rising vacancy forecasts.
- Firming case (late 2026 into 2027): as starts remain low and deliveries fall, concessions burn off and rent growth resumes. Supported by the supply cliff narratives and starts declines.
Examples from the field
Austin operator chooses base-case rents, soft-case leasing. A fourplex owner near a new Class A lease-up forecasts flat rent for the year, but budgets for higher turnover and marketing costs in the soft case. When specials appear across the street, they offer a 13-month lease with a one-time credit instead of cutting face rent, protecting comps.
Phoenix landlord plans for "concessions now, tightening later." Given elevated vacancy but falling starts, the landlord accepts near-term concessions to protect occupancy, while planning to remove them once deliveries slow (late 2026 / 2027 logic).
NYC PM avoids over-forecasting cap rates. NYC's supply constraints support rent growth, but regulatory uncertainty (good-cause eviction proposals) can affect underwriting. A conservative scenario keeps growth moderate while reserving for compliance costs.
Two takeaways
- Use effective rent (after concessions) as your primary forecasting variable. Keep face rent as a secondary metric for comp positioning.
- Update your scenario quarterly. A forecast that is not refreshed is just a guess with math.
Step 5: Adjust pricing and lease terms without violating fair housing or local rules
Pricing is where trend-watching becomes money. But it must be compliance-minded. Fair housing, anti-discrimination laws, rent-stabilization rules, notice periods, and any local caps.
Pricing levers beyond "raise or drop rent"
- Lease length. Offer 13 to 18-month terms in softer seasons to stabilize occupancy. Common winter strategy.
- Concessions vs. rent cuts. A one-time concession can be easier to remove than a permanent rent reduction, especially when the market tightens later.
- Renewal segmentation. Long-term, low-maintenance tenants may justify slightly below-max increases to reduce turnover costs.
- Fees and utilities. Ensure any fee changes comply with state and local rules and are disclosed consistently.
Seasonality matters again
Zillow documented that classic seasonality returned. Spring bounce, summer plateau, autumn slide, and winter weakness with incentives rising in colder months. That should influence when you test rent increases and when you prioritize occupancy.
Examples from the field
Austin student-cycle leasing. Austin's absorption is seasonally heavy around spring and the academic calendar. A landlord who lists in late spring can price firmer. One who lists in November may need to compete on terms or concessions rather than face rent.
Phoenix hot-weather moving season. Phoenix tends to see stronger move-in demand in spring. A landlord can schedule turns and marketing for March through May, then avoid major vacancies in late summer and early fall when demand often cools.
NYC regulated increases. In NYC, rent-stabilized guideline increases constrain renewals (3.0% for 2025 to 2026). Even if market-rate comps spike, regulated units require strict adherence to permissible increases and notices.
Two takeaways
- Create a written pricing policy: what data you use, how you apply concessions, and how you ensure consistent criteria across applicants and renewals.
- Time your rent testing to seasonality. Push hardest in spring and summer. Defend occupancy in winter with terms and marketing speed.
Step 6: Plan capital improvements that match where demand is "sticking"
When Class A vacancy runs higher than B and C (Cushman and Wakefield: 10.3% vs. 7.4% in Q3 2025), the implication is not "never renovate." It is to renovate to the rent band where demand is resilient.
A landlord-grade ROI approach
- Identify what competes with you today (your comp set).
- Determine whether your tenants are trading up to new supply due to concessions.
- Pick improvements that either reduce turnover (durability, comfort), widen your applicant pool (in-unit laundry, parking, pet features), or protect against regulation and insurance issues (life safety, water mitigation).
Examples from the field
Phoenix: defensive upgrades beat luxury finishes. With higher vacancy, a Phoenix landlord skips quartz-and-gold hardware and instead installs resilient flooring, better HVAC maintenance, and a smart lock to reduce turn time. They price near the middle of the market to avoid competing directly with new luxury supply offering 6 to 8 weeks free.
Austin: focus on noise, internet, and work-from-home basics. In a market where tech employment remains an important demand driver but renters have options due to supply, "daily-life upgrades" (acoustic fixes, strong internet readiness, lighting) can improve leasing without overspending.
NYC: compliance-first capex. In older NYC buildings, capex often prioritizes systems and code compliance. With tight vacancy, the goal is often to preserve reliability and reduce emergency repairs rather than chase the newest finishes.
Two takeaways
- In soft markets, prioritize turn-cost reduction and speed-to-lease improvements over cosmetic upgrades that only matter at the luxury tier.
- Track upgrade rent premium using your own lease data. Compare achieved rent and days-on-market for upgraded vs. non-upgraded units.
Step 7: Use technology for monitoring and operations without outsourcing judgment
Technology will not replace market understanding, but it can make trend monitoring routine.
Where tech helps most
- Rent comp tracking. Simple spreadsheets, saved searches, or paid tools.
- Listing performance. Views, inquiries, conversion to showings.
- Turn coordination. Task templates for make-ready, vendors, and inspections.
- Data cadence. Monthly dashboard updates.
A compliance note on rent-setting tools
If you use any automated pricing recommendations, keep a human review process and document your rationale. Also stay aware of your local regulatory environment. Some jurisdictions scrutinize algorithmic pricing and tenant protections more heavily.
Examples from the field
Phoenix landlord uses permit and delivery awareness. By monitoring nearby completions and concession language in listings, a landlord chooses a slightly lower face rent but removes application fees and offers a move-in date guarantee, capturing demand before competing buildings flood the market.
Austin manager tracks concessions weekly. When concessions expand in winter, they shift marketing to emphasize total move-in cost and offer a longer lease term rather than a steep rent cut, keeping renewal baseline intact.
NYC PM creates a renewal calendar. Because seasonality is muted by tight inventory, they focus on compliance: renewal notice timing, lawful increases, and documentation, reducing disputes and vacancy risk.
Two takeaways
- Automate data collection where possible, but keep a monthly market review meeting (even if it is just you) to interpret what the numbers mean.
- Measure what you can control. Days vacant, lead-to-lease conversion, and renewal acceptance rate are often more actionable than metro-level rent indices.
Local Rental Market Tracker (Copy/Paste Template)
Use this as an inline template for a spreadsheet or notes app. The goal is to convert "rental market trends" into repeatable monitoring.
A) Your Property Snapshot (update monthly)
- Property / address / submarket
- Unit types (for example, 2x1, 3x2) and target tenant profile
- Current in-place rent by unit type
- Renewal offers sent and accepted (%)
- Average days vacant last 90 days
- Turn cost per vacancy (repairs + lost rent estimate)
B) Comp Set Tracker (update weekly in peak season, biweekly otherwise)
Pick 8 to 15 comps within 1 to 3 miles, or same school zone or transit shed. For each comp:
- Comp name and distance
- Unit type comparable to yours
- Advertised rent
- Concessions yes or no, describe (for example, 6 weeks free, $1,000 gift card)
- Availability count (how many units like yours)
- Days on market if available
- Notes (new management, renovation, parking changes)
Decision triggers:
- If 30% or more of comps offer concessions, switch from rent increases to term and concession strategy (one-time credits, longer lease).
- If your days-on-market exceeds the comp average by 25% or more, review photos, showing speed, and condition before cutting price.
C) Supply Pipeline Signals (update quarterly)
- Multifamily starts trend (national context: Census multifamily starts 470,000 seasonally adjusted annual rate in March 2026)
- Local deliveries (new buildings opening within 3 miles)
- Units under construction nearby (drive-bys + city planning notes)
- BTR / SFR activity (NAHB: 68,000 BTR starts in 2025, down 19% year-over-year)
D) Macro and Affordability (update quarterly)
- Unemployment trend (BLS: 4.2% April 2026)
- Shelter CPI trend (BLS: 4.6% March 2026)
- Mortgage-rate narrative (Redfin outlook around 6.3% in 2026)
- Rent-to-income estimate for your tenant base (use local income proxies)
E) Your Forecast (update quarterly)
- Next 6 to 12 months: soft, base, firming scenarios
- Assumed vacancy range
- Assumed effective rent growth range
- Planned pricing actions and capex plan
FAQ
Is the rental market going up or down in 2026?
At the national level, it is mostly flat, with small increases in some measures and small declines in others. Yardi Matrix showed advertised multifamily rent up 0.1% year-over-year in March 2026, Zillow's ZORI showed in-place rent up 1.8% in March 2026, and Redfin reported median asking rent down 1.0% year-over-year in April 2026. The more accurate answer is that direction depends on your metro and submarket, especially how much new supply is leasing up nearby.
Why do rent indices disagree so much?
They often measure different things. Asking-rent indices like Yardi and Redfin capture today's listing market and respond quickly to concessions and competition. Observed and in-place indices like Zillow ZORI reflect what tenants actually pay across occupied units and can lag turning points. Use at least one of each so you can see both leasing pressure and revenue reality. Mixing them creates misleading conclusions about your own performance.
What is the single biggest indicator landlords should watch right now?
In most markets, it is local supply delivery plus concessions. National vacancy is rising (Census 7.3% in Q1 2026), and CoStar forecasts higher vacancy into late 2026. But whether that hits you depends on whether new buildings in your comp set are offering specials that pull tenants away. Watching deliveries within a 1 to 3-mile radius is more useful for pricing decisions than any metro or national headline.
Will rents rise again in 2027?
Many outlook narratives suggest potential firming after the current delivery wave, because multifamily starts have fallen from the peak (Census: 470,000 in March 2026 vs. the 2022 peak), and under-construction totals are declining. That does not guarantee a rebound everywhere, but it supports the case for late 2026 and 2027 tightening in markets where deliveries drop meaningfully. Watch the local pipeline, not the national headline.
What to Do in the Next 30 Days
Turn this guide into a working system.
- Set up the Local Rental Market Tracker (above) in a spreadsheet.
- Choose your comp set (8 to 15 properties) and start tracking concessions weekly for one full month.
- Write a 3-scenario forecast (soft, base, firming) for your next two leasing seasons and tie each scenario to actions:
- Soft: faster leasing, one-time concessions, tighter screening consistency, higher marketing cadence.
- Base: modest renewals, selective upgrades, stabilize occupancy.
- Firming: remove concessions first, then test rents seasonally.
- Commit to one habit: a monthly market review (30 minutes) where you update vacancy days, comp rents, concession prevalence, and nearby deliveries.
In a flat national environment, landlords who win are rarely the ones with the fanciest forecast. They are the ones who notice the local turn first and adjust pricing and operations without breaking compliance.
The work that turns market awareness into NOI happens at the property level. Days vacant, lead-to-lease conversion, renewal acceptance rate, and turn cost are the metrics you can actually move. That is where Shuk fits. Shuk gives you payment and income reports filtered by property and date range, document storage for leases and lease addenda, in-app messaging for tenant communication, and maintenance request tracking that documents every repair from submission to completion. The data discipline this article advocates lands harder when your operational records are clean and exportable.
Book a demo at shukrentals.com/book-a-demo to see how Shuk's payment and income reports, document storage, in-app messaging, and maintenance request tracking work together so the next time you sit down for a monthly market review, your property data is ready instead of scattered across bank exports, spreadsheets, and text threads.
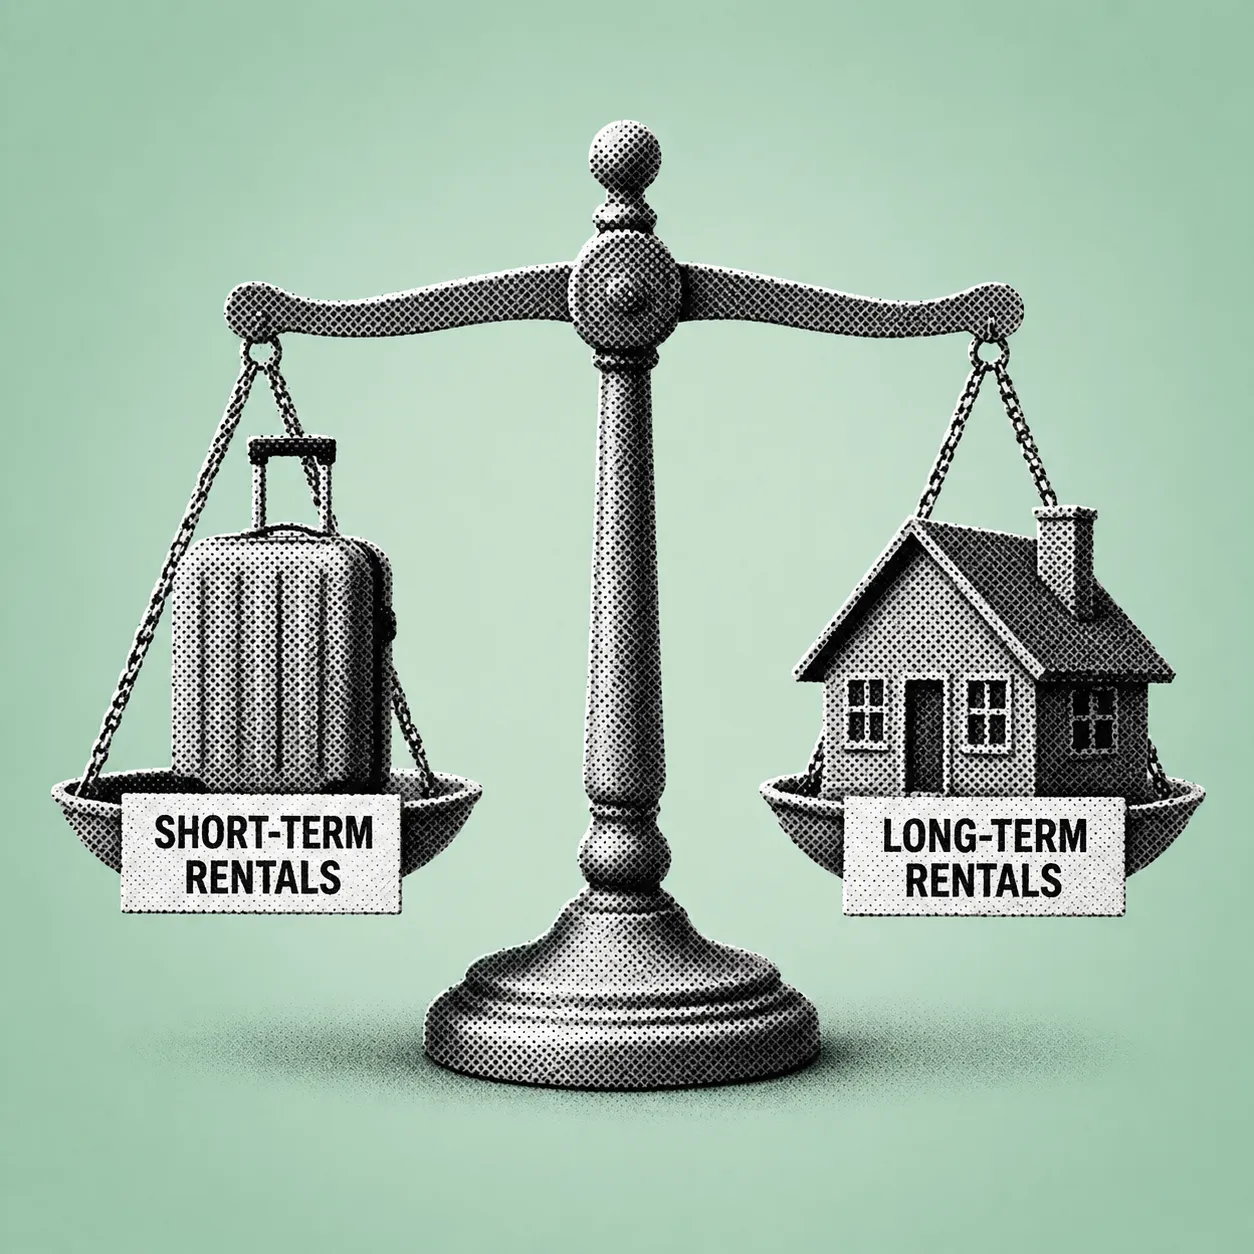
Short-Term vs. Long-Term Rental Strategies: A Practical Decision Framework
Rental property ownership offers more revenue paths and more ways to misjudge risk than ever before. On one side sits the short-term rental model: Airbnb-style stays, dynamic pricing, and hospitality operations. On the other sits the long-term rental model: traditional 12-month leases, predictable cash flow, and landlord-tenant compliance. The question many landlords now ask is more nuanced than which earns more. It is whether to run short-term versus long-term rentals, or whether to build a hybrid strategy that adapts to seasonality and market cycles.
The decision is not just about which option generates more money. In 2024, U.S. short-term rentals generated $67.3 billion in revenue with an average daily rate around $310 and occupancy at 54.3%, a large market with real demand but also real competition and volatility. Meanwhile, the traditional rental market is being reshaped by shifting vacancies, with the national rental vacancy rate reaching 7.2% in Q4 2025, ranging from 5.2% in the Northeast to 9.1% in the South, and ongoing rent growth pressures.
The best strategy depends on your property, your tolerance for operational complexity, local regulations, and how you want to be taxed, especially since short-term rental income can behave more like business income while long-term rental income is typically passive. Before you optimize revenue, decide what you are optimizing for: stability, time, risk, or maximum net income.
How Short-Term, Long-Term, and Hybrid Models Compare
Short-term rentals trade operational intensity for revenue upside. Long-term rentals trade some upside for predictability. The deciding factor is usually net operating income and cash flow stability after accounting for platform fees, utilities, cleaning, turnover, maintenance, insurance, and compliance overhead rather than gross revenue.
Short-term rental market reality: Performance has normalized after the post-2020 boom. AirDNA's U.S. overview describes a new equilibrium where 2024 saw supply growth of 6.4% and demand growth of 10.7% alongside slightly lower occupancy at 54.3% but improved revenue per available room thanks to rate gains. The market is still large, but hosts compete harder and must operate smarter. Pricing, reviews, amenity packages, and response times all matter more than they did in 2021.
Long-term rental market reality: Long-term rentals respond more slowly and are shaped by vacancy, wage growth, and new supply. In markets like Austin, rents fell from highs as inventory increased, with two-bedroom rents around $1,713 in one snapshot with noted declines before projected recovery. Nationally, vacancy differences matter because they change lease-up risk and the need for concessions.
Hybrid rental strategy: A hybrid model sits between the two. You run short-term rentals during peak seasons or around local events and convert to medium-term stays of 30 or more days or annual leases in slow months. Hybrid approaches are especially relevant in tourism-heavy markets where short-term demand spikes seasonally and in cities with tighter short-term rental rules where longer stays may reduce regulatory friction.
How owners choose based on market type:
In a tourism metro like Orlando, AirDNA projects an average daily rate near $245 with strong demand patterns, often supportive of short-term rentals if regulations and HOA rules allow it. In a supply-heavy long-term market like Austin, falling rents can pressure long-term rental pricing, and short-term rental can look attractive on gross revenue but must beat higher operating costs and competition to win on net operating income. In a high-vacancy region like the South at 9.1% vacancy, long-term lease-up risk increases and short-term rentals might diversify demand, but only if the property can attract travelers and you can manage seasonality.
Build two models: short-term rental as a hospitality business and long-term rental as a housing service. Then compare net operating income, risk profile, and time requirements before committing to either.
A Seven-Step Decision Framework
Step 1. Start With a True NOI Comparison, Not Gross Revenue
A clean comparison starts with the same output: net operating income calculated as income minus operating expenses before debt service. Short-term rentals often look better at the top line, but expenses can scale faster because every stay creates work and cost.
Use market baselines to sanity-check your short-term rental revenue assumptions. AirDNA reports 2024 occupancy of 54.3% and an average daily rate of $310 as national benchmarks, with market-specific results varying widely. If you model 75% occupancy at premium rates in a saturated market, your forecast is likely optimistic unless your property is unusually differentiated.
Example calculations: Short-term rental gross at an average daily rate of $250 times 54% occupancy times 365 days equals approximately $49,275 in gross revenue. Long-term rental gross at $2,000 per month times 12 months equals $24,000 in gross revenue. Then subtract the full expense stack. Short-term rentals may include cleaning, supplies, utilities, platform fees, higher wear-and-tear, and more administrative time. Long-term rentals commonly include repairs, leasing, and management costs that are more predictable.
Model base, conservative, and downside scenarios including occupancy minus ten percentage points and average daily rate minus five percent, because short-term rental revenue fluctuates with demand and supply. Track expense ratios as percentages of revenue. Your short-term rental profit margin is often the real differentiator between a good investment and a break-even operation.
Step 2. Benchmark Expenses Realistically
Expense realism is where many first-time short-term rental operators lose money. Short-term rental variable costs include cleaning, utilities, and platform fees, while fixed costs include furnishings and elevated maintenance due to higher turnover. Long-term rental expenses tend to cluster around ongoing maintenance, leasing and turnover, and property management.
Long-term rental expense benchmarks: A common planning range is 12% to 15% of rent for maintenance and 8% to 12% for property management, with taxes, insurance, and other costs on top. Even if your actual numbers differ, these ranges help you avoid underestimating what stable rentals cost to run.
Mini-examples: If cleaning costs $140 per turnover and your average stay is three nights, that is effectively approximately $47 per night in cleaning cost alone. Increasing average stay length often improves short-term rental margins significantly. Paying 10% management on a $2,000 rent is $200 per month, but it may reduce vacancy days and improve compliance documentation. Short-term rental furniture replacement every three to five years can be a meaningful annualized cost, while long-term rentals often have lower furnishing needs but may face larger capital expenditures at turnover.
For short-term rentals, design for durability using commercial-grade linens and stain-resistant finishes to control replacement cycles. For long-term rentals, budget vacancy and turnover explicitly covering lease-up costs, make-ready, and marketing even if you self-manage.
Step 3. Treat Regulations as a Go/No-Go Gate, Not an Afterthought
Regulatory risk is asymmetric. In many municipalities, your short-term rental can be legal today and restricted tomorrow. Municipal rules vary significantly, making it essential to map your property to three regulatory layers before spending money on furnishing or setup.
The three layers to verify: City and county short-term rental ordinances covering permits, caps, primary residence rules, night limits, and lodging taxes. Zoning and land-use rules confirming whether short-term rentals are allowed in the district. Private restrictions including HOA rules, condo bylaws, and lease terms if you are subletting.
Examples of regulatory friction: Permit caps and waitlists can make a profitable short-term rental impossible to legally operate if permits are capped and transfer rules are strict. Primary residence requirements can force investors relying on non-owner-occupied short-term rentals to convert to long-term or mid-term rentals. Noise and parking enforcement can trigger fines or permit revocation, raising operational demands significantly.
Before spending on furnishing, confirm the path to compliance covering registration, inspections, local lodging taxes, and insurance requirements. Build a conversion-ready plan and know what rent you would need to break even if you must switch to a long-term rental quickly.
Step 4. Measure Management Complexity Honestly Because Time Is a Cost
Short-term rentals are hospitality. Long-term rentals are housing. The skill sets overlap but they are not identical.
Growing competition in the short-term rental market means smarter pricing and improved guest experiences are increasingly required, both of which add management overhead. In practice, short-term rental operators handle dynamic pricing, guest messaging, cleaner coordination, restocking, same-day issue resolution, and reputation management through reviews. Long-term rental owners focus more on tenant screening, leases, maintenance scheduling, renewals, and compliance documentation.
Realistic operator outcomes: A short-term rental success story involves an owner in a tourism corridor who improves profitability by switching to data-driven pricing, tightening minimum-stay rules in high season, and reducing vacancy gaps with weekday discounts, stabilizing occupancy despite rising listings. A short-term rental failure story involves a host who underestimates operations: inconsistent cleaning leads to poorer reviews, which reduces bookings, and occupancy falls below the national 54.3% benchmark so the unit cannot cover fixed costs. A long-term rental success story involves a small landlord who prioritizes tenant quality and a renewal strategy, with fewer turnovers reducing make-ready costs and vacancy loss even when rent is slightly below the top of market.
If you want short-term rental returns without short-term rental labor, price in professional management or simplify with longer minimum stays. For long-term rentals, invest in screening and renewals. One bad placement can wipe out a year of stable cash flow.
Step 5. Account for Market Forces: Supply Growth, Seasonality, and Vacancy Cycles
Your rental strategy should match the demand engine of your location rather than a national average.
Short-term rental market forces: In 2024, demand and supply rose at nearly the same pace with competition remaining intense even as the market grows. Earlier in 2023, revenue per available room fell 14.1% due to declining average daily rate and occupancy, an important reminder that short-term rentals can swing materially year to year.
Long-term rental market forces: Vacancy is your key macro signal. The U.S. rental vacancy rate reached 7.2% in Q4 2025 with the South at 9.1% and the Northeast at 5.2%, a spread that materially changes leasing risk and rent growth power. Research from NMHC links vacancy to rent growth dynamics, reinforcing that supply shifts can quickly change landlord leverage in any given market.
Market-specific examples: In Orlando, short-term rental can thrive with tourism-driven demand and projected average daily rates around $245, but owners must plan for shoulder seasons and rising competition. In Austin, as rents retreat from highs amid increased supply, long-term rental owners may need concessions or unit upgrades to maintain occupancy. In suburban markets with strong livability signals like Overland Park, Kansas, renter demand can concentrate even when other markets soften.
Use short-term rental data covering average daily rate, occupancy, and revenue per available room alongside long-term rental data covering vacancy and rent trends before choosing a model. If your market is volatile, consider a hybrid plan that adjusts with seasons and local events.
Step 6. Understand Tax Implications
Taxes can flip the winner between models, especially since short-term rental income may be treated differently from long-term rental income depending on your situation.
Long-term rental basics: Long-term rentals are typically reported on Schedule E as passive rental income, allowing deductions for mortgage interest, property taxes, insurance, repairs, and depreciation. Confirm specifics with a tax professional for your situation.
Short-term rental tax considerations: Short-term rentals often involve more services such as cleaning, linens, and guest support. Depending on facts and circumstances including average stay length, services provided, and participation level, income may be treated more like active business income and could trigger additional tax considerations. Expense categories can also expand to include supplies, software, and cleaning labor.
Examples of tax-driven strategy choices: A high-income W-2 landlord may prefer long-term rentals to keep operations passive and simple, with depreciation and stable income fitting a long-term wealth plan. An operator with time and systems may lean toward short-term rentals, tracking expenses meticulously and treating the property like a small hospitality business. A hybrid owner using mid-term stays of 30 or more days can potentially reduce turnover costs and simplify certain local tax and compliance burdens, though rules vary by jurisdiction.
Decide early how you will keep books. Short-term rentals need category-level tracking of cleaning, supplies, and platform fees to defend deductions. Get professional tax guidance before switching models since the best strategy is often the one with the best after-tax outcome for your household, not the highest gross revenue.
Step 7. Build a Hybrid Rental Strategy for Flexibility When It Makes Sense
A hybrid model can be a smart middle path when you have seasonality, regulatory uncertainty, or personal time constraints.
Common hybrid patterns: Short-term rental in peak months combined with mid-term stays in the off-season reduces vacancy gaps and cleaning frequency while capturing high-season average daily rates. Event-based short-term rental keeps a unit on long-term leases most of the year and adjusts to short-term or mid-term only when legally and contractually feasible, which requires careful lease structure. A dual-unit strategy operates one unit as a short-term rental and one as a long-term rental to balance risk and workload across the portfolio.
Mini-examples: A beach-market owner runs short-term rentals during summer and targets traveling nurses or corporate stays during winter through mid-term arrangements, stabilizing occupancy year-round. An urban owner shifts to longer minimum stays as competition rises, trading some average daily rate for fewer turnovers and steadier reviews. A landlord in a tightening regulatory environment keeps the unit long-term-rental-ready with durable neutral furnishings and a leasing plan ready if permit rules change.
Hybrid works best when your property can appeal to multiple tenant segments without constant reconfiguration. Write your operating plan like a switch and define the trigger metrics covering occupancy threshold, regulatory change, or vacancy rate movement that cause you to pivot between models.
Decision Checklist and True NOI Template
Strategy fit scoring: Score each factor from one to five with five being strongly favorable, then total each column.
Local rules clearly allow the model covering permits, zoning, and HOA. Demand profile supports the model covering tourism versus resident renters. Revenue outlook using realistic benchmarks covering average daily rate and occupancy for short-term rentals or rent and vacancy for long-term rentals. Expense control covering cleaning and utilities for short-term rentals versus maintenance and management for long-term rentals. Your time availability or budget for professional management. Risk tolerance for year-to-year swings. Financing and insurance compatibility. Tax complexity you are willing to handle.
True NOI template to fill in monthly averages:
Income: short-term rental is average daily rate times occupancy times days. Long-term rental is monthly rent.
Operating expenses: property taxes, insurance, maintenance and repairs benchmarked at 12% to 15% of rent for long-term rental planning, management benchmarked at 8% to 12% for long-term rental planning. Short-term rental only: cleaning, utilities, platform fees, and supplies.
Net operating income equals income minus operating expenses.
Downside test: occupancy minus ten percentage points for short-term rental or vacancy plus one month per year for long-term rental, and record the resulting net operating income.
Frequently Asked Questions
Is an Airbnb-style short-term rental always more profitable than a long-term lease?
No. Short-term rentals can produce higher gross revenue, but they often carry higher variable expenses and more volatility. National short-term rental benchmarks show 54.3% occupancy in 2024 and rates that vary widely by market, so even a modest occupancy drop can materially change net operating income. The comparison must be made at the net operating income level, not gross revenue.
What occupancy rate should I assume for a short-term rental?
Start conservative and ground your model in local market data. AirDNA's national snapshot is 54.3% occupancy for 2024, but your neighborhood, property type, and seasonality can push you above or below that figure. Build a base case and a downside case before committing to any furnishing investment.
How do vacancy rates affect long-term rental strategy?
Vacancy determines pricing power and lease-up risk. The U.S. rental vacancy rate was 7.2% in Q4 2025, but regions vary significantly with the South at 9.1% and the Northeast at 5.2%. Higher vacancy in your region can change how aggressively you underwrite rent and how many concessions you need to budget.
When does a hybrid rental strategy make the most sense?
Hybrid is most effective when demand is seasonal, regulations are uncertain, or you want to balance workload and income stability. It works best when the unit can succeed with both traveler and resident segments without major reconfiguration between uses. Define your pivot triggers in advance rather than reacting under pressure.
Pick one property and run the decision tool above this week. Pull short-term rental benchmarks for your city covering average daily rate, occupancy, and revenue per available room alongside local long-term rental rent and vacancy signals, then build two true net operating income models covering a base case and a downside case. If short-term rental only wins in the optimistic scenario, consider a hybrid strategy or default to a strong long-term lease with renewal-focused management. When the numbers and your lifestyle both agree, you have found the right model.
Book a demo to see how Shuk's leasing, maintenance, and financial tracking tools support both long-term and hybrid rental strategies so you can manage your portfolio with the same rigor regardless of which model you choose.
Frequently Asked Questions
Find answers to common questions about our products and services
What is rental market analysis for landlords in plain terms?
How do I price correctly when rent growth is slowing?
How can I stay competitive without racing to the bottom on price?
Which data sources are most credible for monitoring rents and vacancy?
How often should I update my rental market analysis?
The most common mistake in rental market analysis is treating it as a one-time exercise rather than a monthly habit. A landlord who checks comps once at lease-up and does not revisit effective rent, days-on-market, and concession prevalence until the next vacancy is operating blind in a market that can shift meaningfully within a single quarter. A consistent monthly cadence, even a simple one covering rent comps, vacancy rate, days-on-market, and one renewal decision, outperforms any amount of sporadic deep analysis. Platforms like Shuk are built specifically for independent landlords and property managers with 1 to 100 units, with listing tools, lease tracking, tenant communications, and expense tracking in one connected system that supports both the operational execution and the measurement needed to make market analysis actionable.

