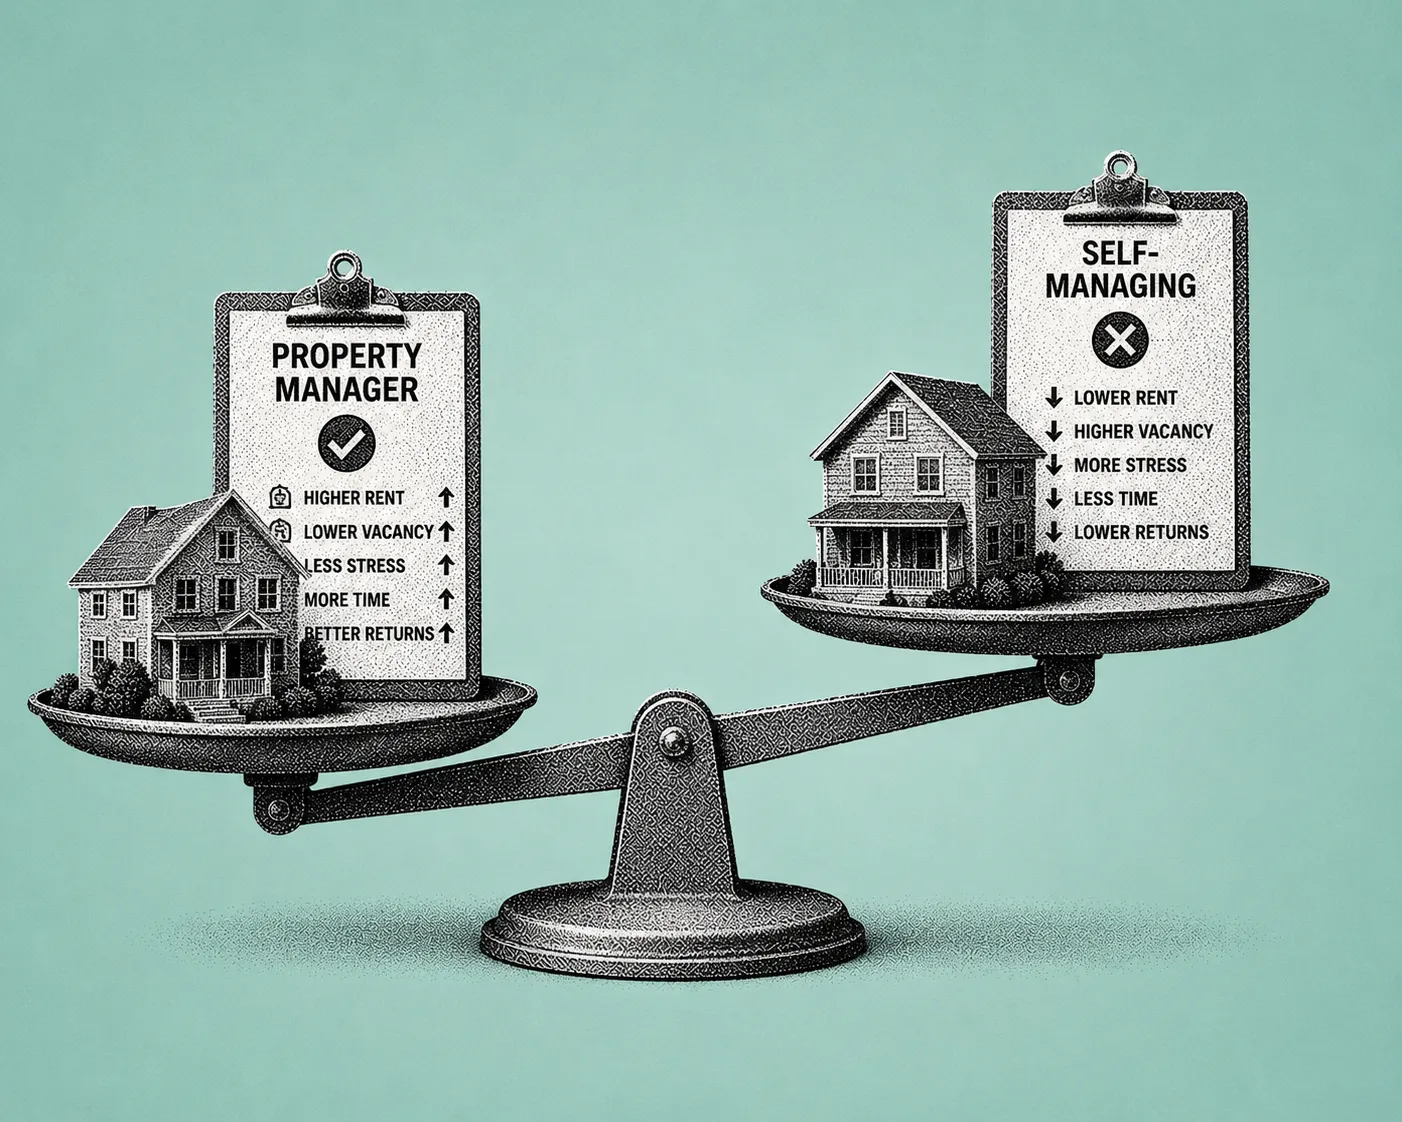
Property Manager vs. Self-Managing: What the Numbers Actually Show
Hiring a property manager looks expensive at first glance. 8% to 12% of gross rent is the typical range, with many contracts landing around 8.5% to 10% nationally. But self-managing is not free either.
The real comparison is total cost. Your time, vacancy days, leasing friction, compliance exposure, maintenance coordination, and the software you need to run rentals predictably.
Most landlords undercount DIY costs because they treat their own labor as "spare time." Yet self-managing commonly takes 8 to 12 hours per property per month. Multiply that by even a modest hourly value and the 8% to 12% fee often is not the problem. Unmeasured operations are.
This guide gives you a numbers-driven framework to compare professional management (fees plus markups plus control tradeoffs) against DIY management (time plus tools plus errors plus opportunity costs), and to calculate break-even unit counts and ROI using a model you can adapt to your portfolio.
What Real Cost Actually Means (and Why Percentages Mislead)
Property management pricing is usually presented as a single number. "10% of rent." In reality, most full-service agreements stack multiple charges.
- Ongoing management: typically 8% to 12% of monthly rent, or sometimes flat $199 to $300 per month.
- Tenant placement or lease-up: commonly 50% to 100% of one month's rent.
- Renewal fees: often around 20% to 25% of one month's rent.
- Setup fees: typically $200 to $500.
- Maintenance markups: commonly around 10%, sometimes more.
- Inspections and eviction admin: inspections around $110 per visit, eviction admin fees sometimes around $500 plus legal costs.
DIY landlords pay differently. They pay in hours and attention. When you self-manage, you still need leasing workflows, tracking, documentation, communication, and compliance. The question is whether you buy those capabilities via a manager, or build them via your time plus software plus processes.
Three things to do before you run the math:
- Stop benchmarking with a single percentage. Build a full-year cost model with turnover and repair assumptions.
- Treat your time as an expense. Even if you enjoy it, it has opportunity cost.
- Compare outcomes, not tasks. The right comparison is net rent collected (after vacancy, fees, repairs) and risk-adjusted headaches.
Step-by-Step: A Numbers-Driven Comparison
Step 1: Calculate the True Cost of Self-Management
Start with the most ignored line item. Your hours. Self-managing landlords commonly spend 8 to 12 hours per property per month on tenant messages, repairs, late rent, bookkeeping, and showings. That is the baseline. Turnovers and emergencies spike it.
DIY cost formula (annual)
- Time cost = hours per unit per month x units x 12 x your $/hour
- Software and tools = subscriptions plus screening plus e-sign plus accounting support
- Vacancy friction = extra vacancy days due to slower leasing or weaker marketing
- Mistake and compliance buffer = late fees not charged, incorrect notices, deposit errors, or preventable disputes. Model as a conservative annual reserve.
For time value, many landlords use what they earn in their job, what it would cost to hire an assistant, or a blended "skilled self-employed" rate. This guide uses $35 per hour as a planning assumption. Swap it for your reality.
Example baseline (per unit)
- Hours: 4 per unit per month (efficient DIY with systems) vs. 10 per unit per month (typical DIY range midpoint).
- Time cost at $35 per hour:
- Efficient: 4 x 12 x $35 = $1,680 per unit per year
- Typical: 10 x 12 x $35 = $4,200 per unit per year
That alone can exceed a manager's fee on many rent levels.
What to do next
- Track your true hours for 30 days. Use a note app and tag tasks (leasing, maintenance, accounting). Your future decision gets easy.
- Separate batch work from interrupt work. Interruptions (calls and texts) are what crush DIY scalability.
- Assign a "stress premium." If you dread tenant messages, your real cost per hour is higher than your spreadsheet says.
Step 2: Model the Full Cost of Professional Management
Professional management usually includes rent collection, maintenance coordination, vendor scheduling, notices, and reporting. But fee structures matter.
Typical annual manager cost components
- Base management fee: 8% to 12% of collected rent.
- Lease-up or placement: 50% to 100% of one month's rent per turnover.
- Renewal fee: around 20% to 25% of one month's rent when renewing.
- Maintenance markup: often around 10% of project cost.
- Other pass-throughs: setup ($200 to $500), inspections (around $110 per visit), eviction admin ($500 plus legal).
Hidden but real costs of hiring a manager
Markup stacking. A 10% maintenance markup can be fine, unless the vendor price is already inflated or repairs are over-scoped.
Less control means slower optimization. You may be slower to upgrade processes, test rent pricing, or implement resident experience improvements.
Incentive mismatches. A percentage fee can align incentives with rent maximization, but also can reduce urgency around cost control. Flat fees create predictability but may reduce upside motivation.
What to do
- Negotiate placement fees. Ask for a flat lease-up fee or a reduced fee on renewals. Placement is where many owners overpay.
- Cap maintenance markup. Put a markup cap in writing and require approval above a dollar threshold.
- Demand a scope plus 3-bid rule above a set amount (for example, $1,000) so convenience does not become silent overspending.
Step 3: Vacancy and Turnover. The Make-or-Break Variable Most Landlords Ignore
Even a strong DIY operator can lose to a good manager if leasing speed and screening quality differ. One extra week vacant is often more expensive than a month of management fees.
Turnover-driven costs to model
- Lost rent during vacancy
- Leasing labor and time (showings, screening, lease prep)
- Placement fees (if managed)
- Make-ready costs (repairs, paint, cleaning)
- Risk of a bad placement (late pays, damage, eviction)
Many managers include marketing in the base fee, but some charge separately. Your model should use your actual contract terms, not averages.
What to do
- Track your days to lease and compare to market norms in your zip code. If you are consistently slower, DIY is costing you.
- Quantify screening misses. One preventable eviction can wipe out years of fee savings. Include a conservative annual error reserve.
- Standardize turnovers. Checklists and templated messages routinely reduce vacancy days, whether you DIY or outsource.
Step 4: Break-Even Analysis: When Does Hiring a Manager Beat DIY?
Below is a practical break-even table using consistent assumptions. You can replace any variable.
Assumptions (editable)
- Average rent: $1,800 per unit per month
- Manager base fee: 10% of rent (midpoint)
- Placement: 75% of one month's rent per turnover (mid-range)
- Turnover rate: 30% per year
- Maintenance spend: $1,200 per unit per year with 10% markup if managed
- DIY time typical: 10 hours per unit per month
- Efficient DIY with software and process: 4 hours per unit per month
- Time value: $35 per hour
- DIY software: $25 per unit per month
Break-even (annual cost per unit)
ModelWhat's includedApprox. annual cost per unitDIY (typical)10 hrs/mo x $35 + software$4,200 + $300 = $4,500DIY (efficient with software)4 hrs/mo x $35 + software$1,680 + $300 = $1,980Professional manager10% mgmt + placement (0.3 x 0.75 mo) + 10% maintenance markup$2,160 + $405 + $120 = $2,685
What this means
- If your DIY workload is near 10 hours per unit per month, a manager can be cheaper per unit even before you price in compliance mistakes or vacancy drag.
- If you can operate at around 4 hours per unit per month with solid systems, DIY is often cheaper, until your unit count grows enough that interruptions break your schedule.
Unit-count break-even (portfolio perspective)
Because both time and most fees scale per unit, the break-even is less about unit count and more about hours per unit and rent level. But unit count matters because DIY hours per unit often rise when you are stretched.
Portfolio sizeDIY typical (10 hrs/unit/mo)DIY efficient (4 hrs/unit/mo)Professional manager4 units$18,000$7,920$10,74020 units$90,000$39,600$53,70060 units$270,000$118,800$161,100
Key takeaway. "Hire a manager at X units" is the wrong rule. The better rule is: if your effective DIY hours per unit per month stay low, DIY wins longer. If you are closer to 8 to 12 hours per unit per month, management often wins early.
What to do
- Calculate hours per unit, not hours total. That ratio is the scalability signal.
- Watch your turnover season. If you self-manage and your leasing months spike your hours, you are underestimating DIY cost.
- Use approval thresholds with managers so the convenience does not inflate maintenance.
Step 5: The ROI Calculator Framework (Plug and Play)
Use this to compare annual net income under both models.
Variables
- U = number of units
- R = monthly rent per unit
- F = manager fee rate (for example, 0.10)
- P = placement fee in months of rent (for example, 0.75)
- T = annual turnover rate (for example, 0.30)
- M = annual maintenance spend per unit
- k = maintenance markup rate (for example, 0.10)
- H = DIY hours per unit per month
- W = your hourly value
- S = DIY software cost per unit per month
- Vd = incremental vacancy days difference (DIY minus manager)
Formulas (annual)
Manager cost (annual) = U x (12 x R x F) + U x (R x P x T) + U x (M x k)
DIY cost (annual) = U x (12 x H x W) + U x (12 x S) + Vacancy impact
Where Vacancy impact = U x (R / 30 x Vd)
Decision metric
- If Manager cost < DIY cost: manager is cheaper, before qualitative factors.
- If Manager cost > DIY cost: DIY is cheaper. Then ask if the extra profit is worth your time and risk.
Worked examples (same assumptions as above, Vd = 0)
4-unit (R = $1,800, F = 10%, P = 0.75, T = 0.30, M = $1,200, k = 10%, W = $35, S = $25)
- Manager: 4 x (12 x 1800 x 0.10) + 4 x (1800 x 0.75 x 0.30) + 4 x (1200 x 0.10) = 4 x 2160 + 4 x 405 + 4 x 120 = $10,740
- DIY typical (H = 10): 4 x (12 x 10 x 35) + 4 x (12 x 25) = $18,000
- DIY efficient (H = 4): 4 x (12 x 4 x 35) + 4 x (12 x 25) = $7,920
20-unit
- Manager: $53,700
- DIY typical: $90,000
- DIY efficient: $39,600
60-unit
- Manager: $161,100
- DIY typical: $270,000
- DIY efficient: $118,800
Now add vacancy differences if you have them. Just 3 extra DIY vacancy days per year (Vd = 3) at $1,800 rent costs about $180 per unit per year (1,800 / 30 x 3), which can quickly erase small DIY savings.
What to do
- Run two DIY scenarios: best month and worst quarter. Most owners decide based on the best month, and regret it during the worst quarter.
- Model placement fee frequency correctly. A placement fee is not monthly. It is turnover-driven.
- Do not ignore renewal fees. If your manager charges renewals (around 20% to 25% of a month), add it.
Step 6: Three Landlords, Three Different Answers
These are realistic, simplified examples using the framework above (numbers are modeled from the fee ranges cited, rents and hours are scenario assumptions).
Case A: 4-unit owner in Dallas (busy W-2 job, high interruption cost)
- Rent: $1,700 per unit, U = 4
- DIY hours: 11 hours per unit per month (newer landlord)
- Time value: $40 per hour
- Manager offer: 10% + 75% placement + 10% maintenance markup
Result. DIY labor alone is approximately 4 x 12 x 11 x 40 = $21,120 per year (before software). Manager base fee is approximately 4 x 12 x 1700 x 0.10 = $8,160 per year. Even after placement and markup, the manager is financially rational because the owner's time is expensive and interruptions are constant.
Case B: 12-unit investor in Phoenix (systems-first DIY, low hours per unit)
- Rent: $1,450, U = 12
- DIY hours: 4 per unit per month (strong templates, batching, reliable vendors)
- DIY software: $30 per unit per month
Result. DIY cost is approximately 12 x (12 x 4 x 35) + 12 x (12 x 30) = $25,920 per year. Manager cost at 10% plus turnover placement can land closer to $30,000 or more depending on turnover. This owner likely stays DIY unless vacancy days creep up or compliance complexity increases.
Case C: 50-unit holder in Indianapolis (portfolio scale, turnover pressure)
- Rent: $1,250, U = 50
- DIY hours: 6 per unit per month baseline, but spikes during summer turnovers
- Turnover: 40%
Result. At this size, the operational bottleneck is not accounting. It is leasing coordination and maintenance triage. A manager's placement fees (50% to 100% of a month) can sting, but if professional operations reduce vacancy by even a few days per turn, the savings can outweigh fees. Many owners here choose a hybrid: outsource leasing and maintenance coordination, keep strategic control.
Your Practical Cost Input Sheet and ROI Box
Use this as a copy-paste template for a spreadsheet.
DIY annual cost inputs
- Units (U): ___
- Average monthly rent per unit (R): ___
- Hours per unit per month (H): ___ (track for 30 days)
- Hourly value (W): ___
- DIY software cost per unit per month (S): ___
- Incremental DIY vacancy days per year (Vd): ___
- Annual mistake or compliance reserve per unit (optional): ___
DIY annual cost = U x (12 x H x W) + U x (12 x S) + U x (R / 30 x Vd) + U x Reserve
Manager annual cost inputs
- Management fee rate (F): ___ (8% to 12% typical)
- Placement fee (P in months): ___ (0.5 to 1.0 typical)
- Turnover rate (T): ___
- Renewal fee (optional): ___ (often 20% to 25% of a month)
- Setup fees (one-time): ___ ($200 to $500 typical)
- Maintenance spend per unit per year (M): ___
- Maintenance markup (k): ___ (often around 10%)
- Inspection fees: ___ (around $110 per visit if applicable)
Manager annual cost = U x (12 x R x F) + U x (R x P x T) + U x (M x k) + other fees
Decision rule (simple)
- If Manager annual cost < DIY annual cost: outsourcing is financially justified.
- If DIY is cheaper, ask: "Is the difference worth the time, risk, and interruption load?"
FAQ
What is a reasonable property management fee in the U.S.?
For full-service residential property management, ongoing fees commonly fall in the 8% to 12% of monthly rent range. Many managers also charge turnover-driven fees like 50% to 100% of one month's rent for placement. Renewal fees often run around 20% to 25% of a month, and maintenance markups around 10% are common. The right comparison is the full annual stack, not the headline percentage.
How long does self-management usually take per unit?
Estimates commonly cited for self-managing landlords are around 8 to 12 hours per month per property. If you have strong systems, batched workflows, and low turnover, you may beat that. If you manage reactively, with no templates and scattered tools, you may exceed it. The single biggest scalability signal is hours per unit, not hours total. Track your real hours for 30 days before you decide.
Are maintenance markups normal with property managers?
Yes. Industry guides frequently note maintenance markups, often around 10% of project cost, as a common practice. The key is transparency, approval thresholds, and limiting markups on large projects. Ask for vendor invoices to be shared, require explicit markup line items, and set an owner-approval threshold above a fixed dollar amount so a 10% markup on a $10,000 project does not happen quietly.
Can management fees and software be deducted?
Many ordinary and necessary rental operating expenses are generally deductible. Property management fees are typically treated as operating expenses in rental accounting practice and reported on Schedule E. For specifics on your situation, consult IRS guidance or a tax professional. Always coordinate with your CPA on fee categorization and any limitations specific to your filing.
What to Do Next
If the math says professional management wins for your situation, hire deliberately. Negotiate placement fees down to a flat amount or a reduced renewal rate. Cap maintenance markups in writing. Set approval thresholds. Require scope and three bids above a fixed dollar amount. Convenience without controls is how the headline 10% becomes the all-in 20%.
If the math says DIY should win, the next step is making DIY reliably efficient, so your hours per unit do not drift upward as your portfolio grows. The break-even tables above show that the difference between 10 hours per unit per month and 4 hours per unit per month is the difference between a manager being cheaper and DIY being dramatically cheaper. That gap is operational discipline. Templates, batched workflows, reliable vendors, and a single connected system instead of scattered tools.
This is exactly what Shuk is built for. Shuk gives systems-first DIY landlords the operational backbone of a property manager without the fees. Online rent collection with zero ACH transaction fees and automatic reminders. Configurable late fees that apply automatically. Tenant screening through our partner. E-signature for leases through our Adobe-powered integration. Maintenance request tracking with photos, documents, and a complete history per property. Centralized in-app messaging with email and push notifications. Schedule E-aligned expense organization. Payment and income reports filtered by property or date range. The Lease Indication Tool polls tenants monthly starting six months before lease end so you get predictive lease renewal insights and reduce the turnover-driven costs this article warns about. Year-Round Marketing keeps your listing current and ready to go live the moment you need it, so vacancy days do not stretch.
At $5 per unit per month with no setup fees, and with White Glove Onboarding included at no additional cost (where the Shuk team handles property setup, account preparation, and renter onboarding for you), Shuk is the systems layer that keeps the hours-per-unit ratio low as your portfolio grows.
Book a demo at shukrentals.com/book-a-demo to see how Shuk's online rent collection with zero ACH fees, automatic reminders, automated late fees, maintenance request tracking, centralized in-app messaging, Schedule E-aligned expense organization, the Lease Indication Tool, and Year-Round Marketing work together so you can self-manage with manager-level process discipline without manager-level fees.