


Tenant Screening Hub

Income Verification for Rental Applications: Best Practices for Landlords

photo of Miles Lerner, Blog Post Author
Miles Lerner

Income Verification Best Practices

Income verification for rental applications is the process of confirming that an applicant earns enough to pay the rent reliably, that the income claimed is genuine and stable, and that the documentation provided accurately represents actual earnings. For independent landlords, income verification is both the most critical screening step for predicting long-term payment behavior and the step most commonly weakened by accepting a single document at face value. Application fraud involving edited pay stubs, falsified employment letters, and manipulated bank statements has become significantly more common, making a multi-source verification approach the functional standard rather than a precaution reserved for suspicious applications.

What Good Income Verification Accomplishes

Effective income verification answers three questions: Is the income real? Is the income stable? And is the income sufficient against the written standard applied to every applicant?

Answering all three requires more than reviewing a single pay stub. It requires a document package that can be cross-validated, an employment or income source confirmation through an independently obtained contact, and a calculation that applies the stated standard consistently regardless of employment type.

Step-by-Step Income Verification Workflow

Step 1. Define the Income Standard in Writing Before Taking Applications

The income standard must be established before any specific applicant's information is reviewed. The most common benchmark is gross monthly income of at least three times the monthly rent. Your specific standard may differ but must be documented and applied equally to every applicant.

The written standard should also specify how you treat different income types, what documentation is required for W-2 employment versus self-employment versus benefits, and what compensating factors allow approval despite income that falls below the standard. Apply the standard to the tenant-paid portion of rent for applicants using housing vouchers rather than the full contract rent. Many jurisdictions protect source of income as a class, and applying the income ratio inconsistently between voucher holders and other applicants creates discriminatory exposure.

Step 2. Collect a Document Package That Enables Cross-Validation

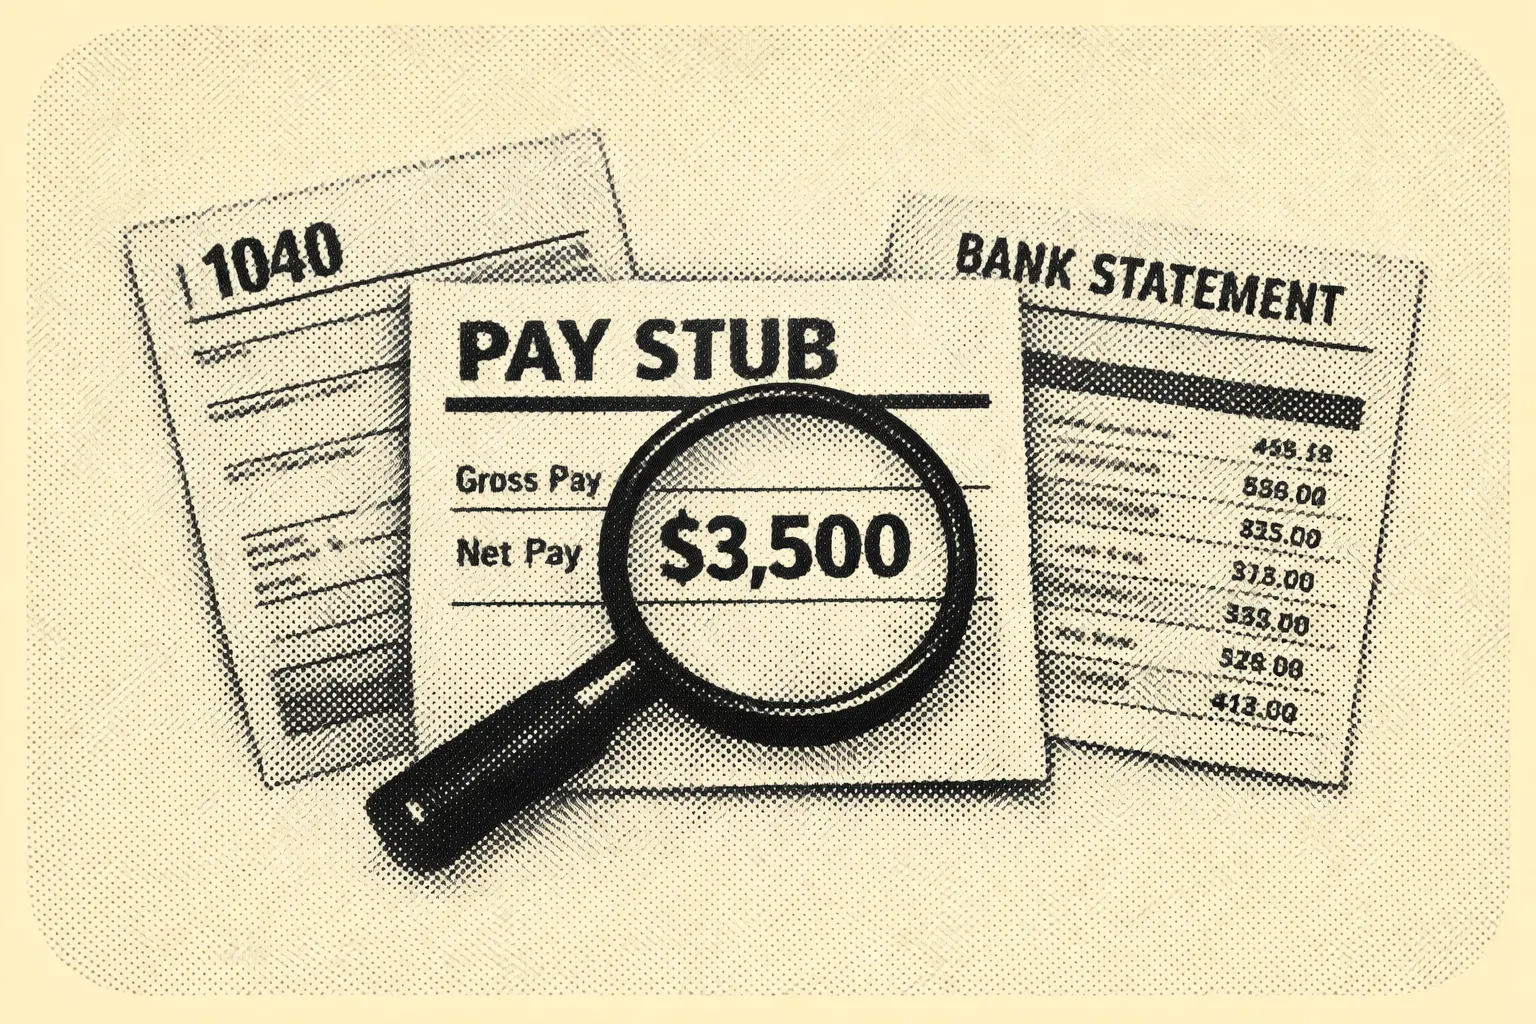
For W-2 employees, the standard package is two to three consecutive recent pay stubs and two months of bank statements showing payroll deposits at the corresponding frequency and net pay amount. An offer letter confirming the employment status and compensation rate is useful as a third source.

For self-employed applicants, the most reliable combination is the prior year tax return with all schedules and three months of business and personal bank statements showing consistent deposits.

For fixed-income applicants receiving Social Security, pension payments, or disability benefits, a benefit award letter downloaded directly from the agency's online portal combined with bank statements showing matching deposits provides reliable verification.

Step 3. Calculate the Rent-to-Income Ratio Using a Consistent Method

Apply the income standard using the same calculation method for every applicant. For employees with variable income components, use a conservative average of the trailing three to six months rather than a peak period. Document the specific income figure used, how it was calculated, and the resulting rent-to-income ratio.

Step 4. Verify Employment and Income Source Through an Independently Obtained Contact

For W-2 employees, verify employment through the main phone number of the employer obtained from a publicly listed source such as the company website rather than from the employment letter or pay stub. Confirm that the applicant is an active employee in the stated role. Log every verification attempt: the date, who was contacted, how, and what was confirmed.

For self-employed applicants, verify through a third source such as a business registration confirmation, client letters, or relevant licensing.

Step 5. Identify and Evaluate Document Red Flags

Pay stubs with identical net pay in every period despite variable hours are a common fraud signal. A calculation of whether the YTD earnings figure is mathematically consistent with the period earnings is one of the fastest fraud detection checks available. Bank statements with formatting inconsistencies across pages or deposit entries that do not correspond to the pay frequency described in the pay stubs warrant a pause and a request for clarification.

Step 6. Document the Decision and Apply the Standard Consistently

Complete the verification with a written record showing the income figure verified, the method of verification, the rent-to-income ratio calculated, whether the standard was met, any compensating factors applied, and the resulting decision. This record should be the same format for every applicant. If a consumer report contributed to the decision, FCRA adverse action requirements apply.

Income Verification Checklist

Pre-screen criteria: Written income standard documented. Income types accepted defined. Variable income averaging method defined. Treatment of voucher and subsidy income documented.

Document collection (W-2 employment): Two to three consecutive pay stubs. Two months of bank statements showing payroll deposits. Offer letter or employment confirmation.

Document collection (self-employed): Prior year tax return with all schedules. Three months of bank and business statements.

Document collection (fixed income): Benefit award letter from agency source. Bank statements showing matching deposits.

Calculation: Verified gross monthly income documented. Variable income calculated using defined averaging method. Rent-to-income ratio calculated and compared to written standard. Result documented in file.

Employment verification: Employer contacted through independently obtained contact. Confirmation documented with date, method, and outcome.

Document authenticity review: YTD figures mathematically checked. Pay frequency consistent with bank deposit pattern. Any anomaly documented and followed up.

Decision: Income standard met or not met documented. Compensating factor applied or not applied documented. File retained per retention policy.

Frequently Asked Questions

What is the standard rent-to-income ratio for rental applications?

The most commonly applied benchmark is gross monthly income of at least three times the monthly rent, corresponding to housing costs of approximately 30% of gross income. Your specific standard may vary but must be documented and applied equally to every applicant. For applicants using housing vouchers, apply the ratio to the tenant-paid portion of rent rather than the full contract rent to avoid source-of-income discrimination in jurisdictions that protect it.

What proof of income should a landlord accept for rental applications?

Acceptable proof depends on employment type. W-2 employees should provide consecutive pay stubs and bank statements showing corresponding deposits. Self-employed applicants should provide tax returns with all schedules and bank statements. Fixed-income applicants should provide benefit award letters and bank statements. Requiring the same documents for the same income type applied equally to every applicant satisfies both the verification goal and the fair housing consistency requirement.

How do landlords verify income for self-employed applicants?

Self-employed income verification relies on the prior year tax return with all schedules for an annual baseline and three months of bank statements showing recent cash flow. A conservative approach averages trailing six to twelve months of deposits rather than using a peak period. When additional confidence is needed, an IRS Form 4506-C authorizing transcript access can corroborate reported tax figures through official records.

What are the biggest income verification red flags to watch for?

The most reliable fraud indicators are YTD figures mathematically inconsistent with period earnings, identical net pay figures in every period despite variable hours, pay frequency that does not match bank deposit patterns, missing standard fields such as employer address or pay period identifiers, and bank statement formatting inconsistencies. Require consecutive documents and verify the basic arithmetic before treating any document as confirmed.

Can a landlord deny an applicant solely because of income?

Yes, if the denial is based on a consistently applied, written income standard supported by a documented calculation. The risk arises when the standard is applied selectively, when different documentation requirements are imposed on different applicants for the same income type, or when the income standard functions as discrimination based on source of income in jurisdictions that protect it.

Book a demo to see how Shuk helps landlords stay ahead of vacancies and keep units filled.

QUICK VIEW
DIVE DEEPER
Stop Reacting to Vacancies. Start Seeing Them Coming.

Shuk helps landlords and property managers get ahead of vacancies, improve renewal visibility, and bring more predictability to every lease cycle.

Book a free 20-min demo to see Shuk today.

Stay in the Shuk Loop

Income Verification Best Practices

Income verification for rental applications is the process of confirming that an applicant earns enough to pay the rent reliably, that the income claimed is genuine and stable, and that the documentation provided accurately represents actual earnings. For independent landlords, income verification is both the most critical screening step for predicting long-term payment behavior and the step most commonly weakened by accepting a single document at face value. Application fraud involving edited pay stubs, falsified employment letters, and manipulated bank statements has become significantly more common, making a multi-source verification approach the functional standard rather than a precaution reserved for suspicious applications.

What Good Income Verification Accomplishes

Effective income verification answers three questions: Is the income real? Is the income stable? And is the income sufficient against the written standard applied to every applicant?

Answering all three requires more than reviewing a single pay stub. It requires a document package that can be cross-validated, an employment or income source confirmation through an independently obtained contact, and a calculation that applies the stated standard consistently regardless of employment type.

Step-by-Step Income Verification Workflow

Step 1. Define the Income Standard in Writing Before Taking Applications

The income standard must be established before any specific applicant's information is reviewed. The most common benchmark is gross monthly income of at least three times the monthly rent. Your specific standard may differ but must be documented and applied equally to every applicant.

The written standard should also specify how you treat different income types, what documentation is required for W-2 employment versus self-employment versus benefits, and what compensating factors allow approval despite income that falls below the standard. Apply the standard to the tenant-paid portion of rent for applicants using housing vouchers rather than the full contract rent. Many jurisdictions protect source of income as a class, and applying the income ratio inconsistently between voucher holders and other applicants creates discriminatory exposure.

Step 2. Collect a Document Package That Enables Cross-Validation

For W-2 employees, the standard package is two to three consecutive recent pay stubs and two months of bank statements showing payroll deposits at the corresponding frequency and net pay amount. An offer letter confirming the employment status and compensation rate is useful as a third source.

For self-employed applicants, the most reliable combination is the prior year tax return with all schedules and three months of business and personal bank statements showing consistent deposits.

For fixed-income applicants receiving Social Security, pension payments, or disability benefits, a benefit award letter downloaded directly from the agency's online portal combined with bank statements showing matching deposits provides reliable verification.

Step 3. Calculate the Rent-to-Income Ratio Using a Consistent Method

Apply the income standard using the same calculation method for every applicant. For employees with variable income components, use a conservative average of the trailing three to six months rather than a peak period. Document the specific income figure used, how it was calculated, and the resulting rent-to-income ratio.

Step 4. Verify Employment and Income Source Through an Independently Obtained Contact

For W-2 employees, verify employment through the main phone number of the employer obtained from a publicly listed source such as the company website rather than from the employment letter or pay stub. Confirm that the applicant is an active employee in the stated role. Log every verification attempt: the date, who was contacted, how, and what was confirmed.

For self-employed applicants, verify through a third source such as a business registration confirmation, client letters, or relevant licensing.

Step 5. Identify and Evaluate Document Red Flags

Pay stubs with identical net pay in every period despite variable hours are a common fraud signal. A calculation of whether the YTD earnings figure is mathematically consistent with the period earnings is one of the fastest fraud detection checks available. Bank statements with formatting inconsistencies across pages or deposit entries that do not correspond to the pay frequency described in the pay stubs warrant a pause and a request for clarification.

Step 6. Document the Decision and Apply the Standard Consistently

Complete the verification with a written record showing the income figure verified, the method of verification, the rent-to-income ratio calculated, whether the standard was met, any compensating factors applied, and the resulting decision. This record should be the same format for every applicant. If a consumer report contributed to the decision, FCRA adverse action requirements apply.

Income Verification Checklist

Pre-screen criteria: Written income standard documented. Income types accepted defined. Variable income averaging method defined. Treatment of voucher and subsidy income documented.

Document collection (W-2 employment): Two to three consecutive pay stubs. Two months of bank statements showing payroll deposits. Offer letter or employment confirmation.

Document collection (self-employed): Prior year tax return with all schedules. Three months of bank and business statements.

Document collection (fixed income): Benefit award letter from agency source. Bank statements showing matching deposits.

Calculation: Verified gross monthly income documented. Variable income calculated using defined averaging method. Rent-to-income ratio calculated and compared to written standard. Result documented in file.

Employment verification: Employer contacted through independently obtained contact. Confirmation documented with date, method, and outcome.

Document authenticity review: YTD figures mathematically checked. Pay frequency consistent with bank deposit pattern. Any anomaly documented and followed up.

Decision: Income standard met or not met documented. Compensating factor applied or not applied documented. File retained per retention policy.

Frequently Asked Questions

What is the standard rent-to-income ratio for rental applications?

The most commonly applied benchmark is gross monthly income of at least three times the monthly rent, corresponding to housing costs of approximately 30% of gross income. Your specific standard may vary but must be documented and applied equally to every applicant. For applicants using housing vouchers, apply the ratio to the tenant-paid portion of rent rather than the full contract rent to avoid source-of-income discrimination in jurisdictions that protect it.

What proof of income should a landlord accept for rental applications?

Acceptable proof depends on employment type. W-2 employees should provide consecutive pay stubs and bank statements showing corresponding deposits. Self-employed applicants should provide tax returns with all schedules and bank statements. Fixed-income applicants should provide benefit award letters and bank statements. Requiring the same documents for the same income type applied equally to every applicant satisfies both the verification goal and the fair housing consistency requirement.

How do landlords verify income for self-employed applicants?

Self-employed income verification relies on the prior year tax return with all schedules for an annual baseline and three months of bank statements showing recent cash flow. A conservative approach averages trailing six to twelve months of deposits rather than using a peak period. When additional confidence is needed, an IRS Form 4506-C authorizing transcript access can corroborate reported tax figures through official records.

What are the biggest income verification red flags to watch for?

The most reliable fraud indicators are YTD figures mathematically inconsistent with period earnings, identical net pay figures in every period despite variable hours, pay frequency that does not match bank deposit patterns, missing standard fields such as employer address or pay period identifiers, and bank statement formatting inconsistencies. Require consecutive documents and verify the basic arithmetic before treating any document as confirmed.

Can a landlord deny an applicant solely because of income?

Yes, if the denial is based on a consistently applied, written income standard supported by a documented calculation. The risk arises when the standard is applied selectively, when different documentation requirements are imposed on different applicants for the same income type, or when the income standard functions as discrimination based on source of income in jurisdictions that protect it.

Book a demo to see how Shuk helps landlords stay ahead of vacancies and keep units filled.

{

  "@context": "https://schema.org",

  "@type": "FAQPage",

  "mainEntity": [

    {

      "@type": "Question",

      "name": "What is the standard rent-to-income ratio for rental applications?",

      "acceptedAnswer": {

        "@type": "Answer",

        "text": "The most commonly applied benchmark is gross monthly income of at least three times the monthly rent, corresponding to housing costs of approximately 30% of gross income. Your specific standard must be documented and applied equally to every applicant. For applicants using housing vouchers, apply the ratio to the tenant-paid portion of rent to avoid source-of-income discrimination in jurisdictions that protect it."

      }

    },

    {

      "@type": "Question",

      "name": "What proof of income should a landlord accept for rental applications?",

      "acceptedAnswer": {

        "@type": "Answer",

        "text": "Acceptable proof depends on employment type. W-2 employees should provide consecutive pay stubs and bank statements. Self-employed applicants should provide tax returns with all schedules and bank statements. Fixed-income applicants should provide benefit award letters and bank statements. Requiring the same documents for the same income type applied equally to every applicant satisfies both the verification goal and the fair housing consistency requirement."

      }

    },

    {

      "@type": "Question",

      "name": "How do landlords verify income for self-employed applicants?",

      "acceptedAnswer": {

        "@type": "Answer",

        "text": "Self-employed income verification relies on the prior year tax return for an annual baseline and three months of bank statements showing recent cash flow. A conservative approach averages trailing six to twelve months of deposits. When additional confidence is needed, an IRS Form 4506-C authorizing transcript access can corroborate reported tax figures through official records."

      }

    },

    {

      "@type": "Question",

      "name": "What are the biggest income verification red flags to watch for?",

      "acceptedAnswer": {

        "@type": "Answer",

        "text": "The most reliable fraud indicators are YTD figures mathematically inconsistent with period earnings, identical net pay in every period despite variable hours, pay frequency not matching bank deposit patterns, missing standard payroll fields, and bank statement formatting inconsistencies. Require consecutive documents and verify the basic arithmetic before treating any document as confirmed."

      }

    },

    {

      "@type": "Question",

      "name": "Can a landlord deny an applicant solely because of income?",

      "acceptedAnswer": {

        "@type": "Answer",

        "text": "Yes, if the denial is based on a consistently applied, written income standard supported by a documented calculation. The risk arises when the standard is applied selectively, when different documentation requirements are imposed on different applicants for the same income type, or when the income standard functions as source-of-income discrimination in jurisdictions that protect it."

      }

    }

  ]

}

Stop Reacting to Vacancies. Start Seeing Them Coming.

Shuk helps landlords and property managers get ahead of vacancies, improve renewal visibility, and bring more predictability to every lease cycle.

Book a demo to get started with a free trial.

Stay in the Shuk Loop

View Similar Articles

View Similar Articles

All Articles
Property Acquisition Hub
What Is the 2% Rule in Rental Property? A Practical Guide for Landlords

What Is the 2% Rule in Rental Property?

When you self-manage a portfolio, even just a few units, the hardest part of buying a rental property is not finding listings. It is filtering dozens of maybe deals down to the few worth your time. Between listing photos, rough rent estimates, shifting interest rates, and market headlines, you can burn hours underwriting properties that were never going to cash flow.

That is why rent-to-price rules of thumb exist. They are not meant to replace real analysis. They help you triage: move quickly, rule out obvious mismatches, and focus your energy where you will get the best return. Among these quick filters, the 2% rule is the most aggressive.

The formula is simple. A property's monthly gross rent should be at least 2% of your total acquisition cost, meaning purchase price plus rehab. If you buy for $150,000 all-in, you would want $3,000 per month in rent.

The catch is that after post-2020 home price increases, the classic 2% benchmark is now rare in many U.S. metros, especially coastal and high-growth markets. That does not make it useless. It means you need to understand when it works, where it breaks, and what to do next once a property passes or fails the screen.

What the 2% Rule Is and What It Is Not

The 2% rule is a rent-to-cost test: a quick rental income metric that compares gross monthly rent to what you invested to acquire the property. Most definitions specify total acquisition cost as purchase price plus rehab needed to get the unit rent-ready. In real-world underwriting, you will often also want to consider closing costs, initial leasing costs like paint and lock changes, and immediate safety or code items.

The higher the monthly rent is relative to what you paid, the more room you typically have to cover operating expenses including taxes, insurance, repairs, vacancies, and property management, and still produce cash flow. That is why percentage rules became popular among cash-flow investors in lower-cost Midwestern markets and why they have been widely discussed in landlord education communities since the early 2000s.

Here is what the 2% rule does not do. It does not account for local expense structures, which can vary dramatically by county and state. It does not incorporate financing terms including interest rate, down payment, or loan structure. It does not measure profitability directly because it ignores vacancy, maintenance, capital expenditures, and tenant turnover. And it does not capture appreciation expectations, which research has shown can be a major component of long-run returns.

Because of those omissions, the 2% rule is a fast smell test, not a full inspection. Use it as a starting filter, then validate the deal with expense-based metrics like cap rate, cash flow projections, and debt service coverage analysis.

How to Use the 2% Rule Without Fooling Yourself

Step 1. Start With the Exact Formula and Define Your All-In Cost Up Front

The calculation is straightforward.

Rent-to-cost ratio = Monthly gross rent divided by total acquisition cost.

A property meets the 2% rule if monthly gross rent is at least 2% of total acquisition cost.

Run the metric two ways for consistency. The core test uses purchase price plus rehab, which aligns with the most common definition. The conservative test adds estimated closing costs and initial leasing expenses, which is closer to your true cash invested. Rules of thumb are already blunt instruments. If your inputs vary deal to deal, the rule produces noise instead of signal.

Step 2. Use Current Market Anchors to Set Realistic Expectations

The biggest reason landlords get discouraged by the 2% rule is that they apply it in markets where it is structurally unlikely. Recent Zillow data illustrates why this matters.

Los Angeles shows average home values near $941,985 and average rents around $2,658, producing a rent-to-value ratio of roughly 0.28% per month. Seattle shows average home values near $848,869 and average rents around $2,258, producing roughly 0.27% per month. Indianapolis shows average home values near $223,231 and average rents around $1,463, producing roughly 0.66% per month. Cleveland shows average home values near $113,669 and average rents around $1,250, producing roughly 1.10% per month. Tampa shows average home values near $369,079 and average rents around $2,213, producing roughly 0.60% per month.

These are broad metro averages, not deal-specific comps. But they illustrate a critical point: the same 2% threshold implies dramatically different feasibility depending on local prices, rent ceilings, and supply and demand conditions.

Instead of asking whether a market meets 2%, ask what rent-to-cost ratios are typical there, and if 2% is unrealistic, what threshold reliably indicates a workable cash-flow candidate. Many modern investor discussions treat 1% or even 0.8% as more realistic in many areas, while still using 2% as a home-run screen in low-cost or distressed value-add contexts.

Step 3. Run the Calculation Step-by-Step: A Midwest Value-Add Example

A landlord finds an older house in the Cleveland area priced below the broader metro average, needing moderate rehab.

Purchase price: $95,000. Rehab to rent-ready: $15,000. Total acquisition cost: $110,000. Expected monthly gross rent: $1,950.

Dividing $1,950 by $110,000 produces a ratio of 1.77% per month. To meet the strict 2% rule, the property would need $2,200 per month in rent.

This property fails the 2% threshold, but it is close. In many real-world scenarios, a 1.7% to 1.8% ratio may still be worth full underwriting, especially if the rehab estimate is tight, tenant demand is strong, and the neighborhood risk profile fits your management capacity. Cleveland's broader metro average produces about 1.10% rent-to-value. A deal at 1.77% is significantly above that average, suggesting a favorable purchase basis, above-average achievable rent, or both. That is often what a good deal looks like in a low-cost market: you are outperforming the typical rent-to-price relationship, not chasing a mythical 2% in every zip code.

Step 4. Contrast With a High-Cost Coastal Market

A landlord evaluates a small duplex in Los Angeles with strong tenant demand but a high acquisition cost.

Purchase price: $950,000. Rehab and turnover work: $25,000. Total acquisition cost: $975,000. Expected monthly gross rent for both units combined: $5,400.

Dividing $5,400 by $975,000 produces a ratio of 0.55% per month. To meet the 2% rule, the property would need $19,500 per month in gross rent, which is far beyond typical long-term rents for most small multifamily properties in any market.

In coastal markets, investors often justify acquisitions through a different return mix: lower current yield paired with potential long-term appreciation, rent growth, tax advantages, and inflation hedging. Academic work on rent-price dynamics confirms that expected capital gains can heavily influence buying behavior even when rent ratios are low. That is precisely why simplistic ratios can mislead if treated as universal laws rather than market-relative tools.

Step 5. Compare the 2% Rule to the 1% Rule

The 1% rule is the more commonly cited version: monthly gross rent should be at least 1% of total acquisition cost. It became widely popular through mainstream landlord education and investor communities and is generally treated as a first-pass filter before deeper underwriting.

The practical difference comes down to thresholds. The 2% rule is a very high bar, often indicating a low purchase price relative to rent, significant distress or value-add, or a higher-risk area where prices are low for a reason. The 1% rule is still a strong quick screen in many markets but is challenging in most coastal metros given current pricing.

Use both as a funnel. If a deal meets 2%, treat it as a priority but scrutinize neighborhood quality, tenant demand, and deferred maintenance, because too good can mean hidden risk. If it meets 1% but not 2%, underwrite it because it may still cash flow depending on expenses and financing. If it fails 1%, do not automatically discard it in expensive markets, but require a strong alternative thesis: appreciation potential, development optionality, ADU value, or a clear repositioning plan.

Step 6. Cap Rate Versus the 2% Rule: What Each Metric Tells You

Both metrics compress a deal into a single number, but they answer different questions.

The 2% rule uses gross monthly rent and acquisition cost, ignores expenses and financing, and is best as a fast screening tool. Cap rate uses net operating income divided by purchase price, which means it reflects operating reality more accurately because it accounts for taxes, insurance, repairs, management, and other operating costs. Cap rate still ignores financing, but it captures the expense differences that the 2% rule cannot see.

Two properties can have identical gross rent and identical acquisition cost but wildly different cap rates if one sits in a high-tax county, a higher-insurance region, or a property with major capital expenditure coming due. A practical workflow for self-managing landlords: use the 2% or 1% rule to filter, then estimate a quick cap rate to sanity-check the operating story, then run full financing and cash flow projections including cash-on-cash return, debt service coverage, and stress tests.

Step 7. Add Market and Property-Type Nuances

Property taxes and insurance can break a deal that passes the 2% screen. Expense structures vary by location and are not captured in a gross-rent ratio. Never buy the ratio without validating expenses first.

Post-2020 pricing has made 2% rare in many markets. Many landlords now operate with a tiered target: 2.0% as exceptional, typically limited to value-add, distressed, or very low-cost market scenarios; 1.0% to 1.5% as the more common cash-flow hunting range in many non-coastal markets; and 0.5% to 0.9% as common in high-cost metros requiring a different investment thesis.

Property type also matters. A duplex or fourplex may produce more rent per dollar of purchase price than a comparable single-family in the same neighborhood. Some high-demand single-family neighborhoods command a rent premium, but purchase prices often outpace rents, pushing ratios down. Broad Zillow averages in Los Angeles and Seattle confirm this dynamic at the metro level.

2% Rule Quick Screen Template

Use this when scanning listings or reviewing off-market leads. Apply the same inputs and the same math consistently so you do not treat deals differently based on how much you like them.

Inputs: Purchase price. Rehab to rent-ready. Closing and initial leasing costs (optional but recommended). Projected monthly gross rent.

Calculations: Core all-in cost equals purchase price plus rehab. Core rent-to-cost ratio equals monthly rent divided by core all-in cost. Conservative all-in cost adds closing and initial costs. Conservative rent-to-cost ratio equals monthly rent divided by conservative all-in cost.

Decision rules: At 2.0% or above, flag as priority and proceed to full underwriting, but scrutinize neighborhood quality, deferred maintenance, and confirmed rent comps. Between 1.0% and 1.99%, underwrite the deal because it may be viable depending on expenses and financing. Below 1.0%, proceed only with a clear alternative thesis covering appreciation, redevelopment potential, exceptional rent growth, or a positioning plan that supports the acquisition at that price.

Next numbers to pull before making an offer: Rent comps for the same bedroom and bathroom count in similar condition. Taxes and insurance estimates using local sources rather than national averages. A rough annual expense budget covering maintenance, reserves, and vacancy. A quick cap rate calculation to compare against what the rent-to-cost ratio suggests.

Frequently Asked Questions

Is the 2% rule still realistic in 2026?

In many U.S. markets, especially high-cost coastal metros, the traditional 2% rule is rarely achievable for standard long-term rentals because prices have outpaced rent growth. Zillow's broad metro data illustrates the gap clearly: in Los Angeles, average home values near $941,985 paired with average rents around $2,658 produce a rent-to-value ratio far below 1%, let alone 2%. That said, 2% can still appear in specific situations including distressed purchases, heavy value-add rehabs, low-cost neighborhoods, and certain rental operations. Use it as a home-run screen rather than a universal expectation.

Does meeting the 2% rule guarantee positive cash flow?

No. The 2% rule is based on gross rent and acquisition cost and ignores operating expenses and financing entirely. A property can pass the screen and still cash flow poorly if taxes, insurance, maintenance, utilities, or turnover costs are high, or if financing terms are unfavorable. Treat it as the first filter, then validate the deal with expense-based metrics like cap rate and a full financing-based cash flow model.

What is the difference between the 1% rule and the 2% rule?

They are the same concept with different thresholds. The 1% rule says monthly gross rent should be at least 1% of total acquisition cost. The 2% rule uses 2% and is therefore much stricter. In today's pricing environment, many investors view 1% as challenging but sometimes workable in lower-cost markets, while 2% is often limited to unusually strong cash-flow deals or higher-risk areas.

If my market cannot hit 1% or 2%, what should I use instead?

Do not force a national rule onto a local market. In expensive metros, broad market data shows rent-to-value ratios closer to a fraction of 1% at the metro level. In those environments, shift your screening toward realistic cap rate estimates, conservative cash flow after financing, and a clearly articulated long-term thesis covering appreciation, rent growth, and repositioning potential. Percentage rent rules do not capture expected capital gains, which research confirms can be a major driver of investor returns in high-cost markets.

If you want to track rent-to-cost ratios alongside the operating metrics that actually drive long-term performance, book a demo to see how Shuk helps landlords monitor income trends, vacancy, and portfolio health from one place.

Rent Collection Hub
What Are the Hidden Costs of ACH Fees in Rent Collection?

What Are the Hidden Costs of ACH Fees in Rent Collection?

ACH (Automated Clearing House) payments are often positioned as the low-cost way to collect rent. Compared with paper checks, they usually are. NACHA has reported median ACH processing costs around $0.26 to $0.50 per payment, while checks can run $2.01 to $4 per payment when you factor in issuance and handling overhead.

Here is what catches landlords off guard. Rent collection is not a one-time payment. It is 12 payments per unit per year, often across multiple properties. And ACH "fees" do not always show up as a single, obvious line item. They can appear as per-transaction charges, percentage-based ACH pricing, return and reversal fees, optional expedited settlement costs, bank fees, and platform pricing structures that quietly shift cost from "software" to "processing."

With ACH volume reaching 35.2 billion payments in NACHA's recent reporting, a clear sign that electronic payments are only becoming more central, landlords and property managers should treat rent collection like any other operational expense. Quantify it, stress-test it at scale, and choose the most transparent structure.

This guide breaks down the hidden costs, shows how "small" fees compound, clarifies who typically pays (and what laws can restrict you), and provides a practical framework, plus simple calculators, to evaluate the true total cost of ownership of your rent-collection setup.

Why ACH Still Gets Expensive in Real Life

ACH is a bank-to-bank network used for payroll, bill pay, and recurring transfers. In rent collection, it typically shows up as an eCheck, bank transfer, or ACH debit where a tenant authorizes a pull from their account.

Two trends make ACH fee scrutiny more important than ever.

Tenants increasingly expect online payments. Buildium has reported that 78% of tenants prefer to pay rent online. That preference shift pushes more landlords to adopt portals and payment tools, sometimes without fully auditing fee structures.

Landlords are under margin pressure. A Realtor.com/Avail survey reported 65.1% of landlords planned to raise rent within 12 months, reflecting rising operating costs and the need to protect NOI. When expenses rise, processing fees that were "small" at 5 units become material at 50 or 200.

Here is the tricky part. ACH fees can be billed in ways that are hard to compare. Some processors charge a flat amount per payment (for example, $1 per EFT in some schedules), others charge a percentage (for example, 0.8% capped at $5 for Stripe's ACH debit pricing), and some platforms layer additional convenience fees, return fees, or settlement upgrades. Even when a platform advertises "low ACH," you may still pay for add-ons like automation, accounting exports, or extra user seats.

To make a good decision, you need to calculate three things. Processing cost per rent payment, platform cost per unit per month, and the cost of exceptions (failed payments, reversals, manual work, and compliance handling). Here is the exact workflow.

Step 1: Identify Your ACH Fee Model. Flat, Percentage-Based, or "Free" With Strings Attached

Start by finding which of these pricing models you are actually on.

A) Flat ACH fee (per transaction)

Common in property portals and some payment tools. Common examples include $1 per EFT in certain bank-direct setups and $1 to $2.50 per ACH in portal pricing. Flat pricing is predictable, but it punishes you as your transaction count grows, even if rents are low.

Example. 50 units x $1.50 flat ACH fee x 12 months = $900 per year.

Example. 10 units x $2.50 x 12 = $300 per year.

Example. 200 units x $1.00 x 12 = $2,400 per year. A "small" fee becomes a meaningful line item.

B) Percentage-based ACH fee

Often described as ACH debit with a cap. Stripe's published ACH debit pricing is 0.8% capped at $5. Percentage fees scale with rent amounts, which can be brutal in higher-rent markets.

Example. $2,800 rent x 0.8% = $22.40, but capped at $5. So $5 per payment.

Example. $900 rent x 0.8% = $7.20, capped at $5. So $5 anyway.

Example. $500 rent x 0.8% = $4.00 (below the cap).

C) "Fee-free ACH" (usually subsidized somewhere else)

Some providers have removed ACH tenant fees to boost adoption. Yardi announced eliminating ACH rent-payment fees starting January 2024. "No ACH fee" can be real, but always verify whether costs appear elsewhere. Monthly platform price, premium tiers, or add-on modules.

What to do next. Pull the actual merchant or processing schedule, not a marketing page. Then write down:

  • ACH fee type (flat vs. % vs. capped)
  • Return and reversal fee
  • Same-day or expedite options
  • Any convenience-fee rules (who pays, when it is applied)

That one-page summary becomes the foundation for the math in Steps 2 and 5.

Step 2: Quantify the Compounding Effect. Small Fees x Doors x Months = Real NOI Loss

ACH costs feel invisible because they are distributed across time and tenants. Here is the fix. Calculate annualized totals and translate them into NOI impact.

Use this inline calculator (copy and paste into a spreadsheet)

Annual ACH Cost = units x % paying by ACH x ACH fee per transaction x 12

If your fee is percentage-based, use:

Annual ACH Cost = units x % paying by ACH x average rent x ACH % fee x 12 (then apply any cap per transaction, if relevant)

Scenario A. Flat fee looks "tiny" but scales fast

  • 10 units, $1.50 fee, 100% ACH. 10 x 1.50 x 12 = $180 per year
  • 50 units. 50 x 1.50 x 12 = $900 per year
  • 200 units. 200 x 1.50 x 12 = $3,600 per year

That $3,600 is the equivalent of replacing a water heater every year in many markets, or funding meaningful preventive maintenance.

Scenario B. Percentage-based is the silent killer at higher rents

  • 200 units x $1,500 average rent x 0.8% = $24 per unit per month. Annual total: $57,600.

Now apply the Stripe-style cap nuance. If the fee is 0.8% capped at $5, each $1,500 payment hits the cap. $5, not $12. The annual cost becomes 200 x 5 x 12 = $12,000 per year. Still substantial, but dramatically different from an uncapped percentage. A reminder to read the fine print.

Scenario C. Adoption rates change the outcome

If only 70% pay via ACH (some still mail checks), your cost is multiplied by 0.7. For a 50-unit portfolio at $1.50 ACH fee: 50 x 0.70 x 1.50 x 12 = $630 per year.

What to do next. Track your effective ACH cost per door per month:

ACH dollars per door per month = Annual ACH Cost / units / 12

If it is above your platform's per-unit monthly software price, your "processing" is likely driving more cost than your "tooling."

Step 3: Understand Who Pays, and the Legal Constraints That Shape Your Fee Strategy

In practice, ACH fees are paid in one of three ways:

  • Landlord absorbs the fee as a cost of doing business (simplifies tenant experience).
  • Tenant pays a convenience fee for choosing a paid method (only if legal and properly disclosed).
  • Hybrid. Tenants pay for cards, landlord absorbs ACH, or tenants pay only for expedited options.

Disclaimer: State and local rules on requiring electronic payment and charging tenant fees vary widely and change. The examples below are illustrative, not a complete or current statement of the law where you operate. Before setting a fee-pass-through policy or restricting payment methods, consult a qualified local attorney.

Federal compliance backdrop

The Electronic Fund Transfer Act (EFTA) and Regulation E govern consumer electronic transfers and require proper authorization and error-resolution procedures. While these rules do not set your processing fee, they shape how you obtain consent and handle disputes. Both of which can create indirect costs if your process is messy. Staff time, rework, chargebacks, and claims.

State rules can limit your ability to require EFT or charge fees

Examples from public reporting:

  • New York. Landlords generally cannot require electronic payment exclusively and cannot charge fees for tenants who opt out of electronic payment systems under Section 235-g.
  • Illinois. Public Act 103-0132 bans mandatory EFT requirements in rental agreements (effective June 30, 2023).
  • Oregon. SB 1523 prohibits exclusive electronic payment requirements and mandates fee-free alternatives.
  • California. SB 611 permits convenience fees for electronic payments so long as landlords offer at least one fee-free payment method. Rules and proposals can evolve, so disclosure and flexibility matter.
  • Texas. Convenience fees can be permitted for optional electronic methods, but they should reflect additional processing cost rather than serve as a penalty.

What to do next (operationally)

  • Offer at least one fee-free payment channel (often check) where required, and document it in tenant instructions.
  • Put any optional payment fees in the lease and portal disclosures, not just in an email.
  • If you manage across states, build a fee-policy matrix by state. Allowed? Must offer fee-free alternative? Can you require EFT? When in doubt, confirm with local counsel.

Policy impact in practice

Example. A 100-unit portfolio charging tenants $2.50 per ACH might face pushback or restrictions in states that prohibit fee-charging for opting out or require a free method. Shifting to landlord-paid ACH could cost: 100 x 2.50 x 12 = $3,000 per year, but may reduce disputes and late payments.

Example. If your current system effectively forces tenants into a paid online method, your legal risk may outweigh the processing revenue.

Step 4: Compare Alternatives. ACH vs. Cards vs. Checks vs. Same-Day ACH (and Where "Free" Really Exists)

ACH is typically cheaper than cards. But not always cheaper than modern account-to-account options depending on your provider and how they price it.

Baseline cost context. NACHA has highlighted median ACH costs around $0.26 to $0.50, while checks can run $2.01 to $4 when you include handling and issuance costs. That is why digital rent collection is so attractive. But landlords do not always get median ACH pricing. They get whatever their platform negotiated and passed through.

Here is a practical comparison of common rent payment methods (typical patterns, verify your vendor schedule):

Method

Typical fee structure

Hidden costs to watch

ACH bank transfer

Flat fee ($1 to $2.50) or % (e.g., 0.8% capped at $5)

Return/NSF fees, reversals, extra charges for "instant," admin time

Credit/debit card

Usually % of rent (often around 2.9% plus a fixed fee)

Chargebacks, higher delinquencies if tenants float balances

Paper check

"No processing fee"

Staff time, lockbox trips, delayed funds, higher per-payment cost cited by NACHA

Same-day ACH

Often an add-on or higher fee (network supports it, pricing varies)

Tenants selecting "faster" options creates inconsistent costs

Zero-fee ACH portals

$0 to tenant or landlord (varies)

Cost may shift to platform subscription or premium modules; some platforms include it structurally

Numerical comparisons (rent = $1,500)

  • ACH flat $1.50. $1.50 per payment. $18 per year per unit.
  • ACH % capped at $5. Hits cap at $1,500. $60 per year per unit.
  • Paper check at $2.01 to $4 cost basis. $24.12 to $48 per year per unit (using NACHA cost range for business checks).

What to do next. Do not compare "ACH vs. card" in isolation. Compare your likely tenant mix. If 80% will pay ACH and 20% will insist on card, your blended cost matters more than the advertised "ACH price."

Step 5: Evaluate Total Cost of Ownership. A Simple Platform Cost Calculator You Can Trust

Processing fees are only one part of the cost. A platform can look "cheap" on the subscription but expensive on payments, or vice versa. Your goal is a single, comparable number. All-in cost per unit per month.

TCO calculator (simple version)

Annual TCO = (Monthly platform fee x 12) + (ACH fees x 12) + (card fees) + (bank fees) + (exception costs)

Then: TCO per unit per month = Annual TCO / units / 12

Scenario 1. 50 units, flat ACH fee vs. capped % fee

Assume 100% ACH, rent $1,500.

  • Flat $1.50 ACH. 50 x 1.50 x 12 = $900 per year
  • 0.8% capped at $5. 50 x 5 x 12 = $3,000 per year

Difference: $2,100 per year, before subscription costs.

Scenario 2. 200 units, mixed adoption and mixed methods

Assume 70% ACH, 30% checks. ACH fee $2.50 (a common portal example).

  • ACH transactions per year = 200 x 0.70 x 12 = 1,680
  • ACH fees per year = 1,680 x 2.50 = $4,200 per year

Now add check handling cost using $2.01 to $4 per check.

  • Checks per year = 200 x 0.30 x 12 = 720
  • Check cost per year = $1,447 to $2,880 per year

Total payment-collection cost basis: $5,647 to $7,080 per year, plus platform subscription.

Scenario 3. Zero-ACH-fee pricing vs. portal pricing

If your platform charges zero ACH transaction fees as a structural pricing choice (not as a promotional waiver), then at 200 units paying monthly, your raw ACH transaction cost is $0. The platform subscription becomes the comparable number.

This illustrates why it is worth understanding whether your platform is passing through true network economics, adding margin, or eliminating the fee entirely.

What to do next. Ask vendors for two numbers in writing.

  • Effective ACH cost per successful payment (including any platform markup)
  • Effective cost per failed payment (returns, reversals, retries)

Those two figures usually explain 80% of your real processing spend.

Step 6: Optimize and Negotiate. Reduce Fees Without Breaking the Tenant Experience

After you measure, you have leverage. Most portfolios can reduce rent-collection costs using a few operational tweaks.

A) Move from % pricing to flat pricing when rents are high (or eliminate it entirely)

If your rent is consistently above the threshold where a percentage fee hits its cap (for example, $625 at 0.8% to reach $5), then you are likely paying the max per payment under capped pricing. Flat pricing or zero-fee ACH can materially reduce cost.

Example. 100 units at $1,800 rent, capped $5. 100 x 5 x 12 = $6,000 per year. If you move to $1 flat: $1,200 per year (savings of $4,800). If you move to zero ACH fees: $0 per year (savings of $6,000).

B) Reduce exceptions (failed payments) through verification and automation

NACHA has emphasized rules and risk management enhancements, including fraud monitoring and Third-Party Sender responsibilities. In landlord terms: fewer bad bank accounts and fewer reversals reduce operational drag.

Example. If 2% of 2,400 annual payments fail (200 units x 12), that is 48 exceptions. Even 10 minutes of staff time each is 8 hours per year. At a $30 per hour loaded cost, that is $240 in labor, before any return fees.

C) Set policy. Landlord-paid ACH, tenant-paid card

Given tenant preference for online payments, absorbing ACH on the landlord side can increase on-time payment and reduce check handling. Many operations keep cards available (tenants who need rewards or float), but pass card fees to the tenant where lawful and disclosed.

D) Look for transparent pricing and automation features

Prioritize platforms that offer:

  • Flat monthly per-unit pricing
  • No hidden fees
  • Automation (autopay, reminders, reconciliation) that reduces labor and late payments

Even small pricing changes compound quickly when multiplied by transactions across a year. On a 200-unit portfolio, the difference between a capped-percentage fee and zero ACH fees is the difference between paying $12,000 in transaction fees and paying nothing at all.

ACH Fee Audit and Platform TCO Worksheet

Use this template to audit your current setup in 15 minutes.

1) Your portfolio basics

  • Units: ___
  • Average monthly rent: $___
  • % tenants paying online: ___% (benchmark: tenants prefer online at high rates, around 78%)
  • % paying by ACH vs. card vs. check: ACH ___% / Card ___% / Check ___%

2) Processing fees (from your vendor schedule)

  • ACH fee: Flat $___ per payment or % (cap $)
  • Return/NSF/reversal fee: $___
  • Same-day or expedite fee (if offered): $___
  • Card fee (if accepted): % + $

3) Annual cost calculations

  • ACH annual cost = units x ACH% x ACH fee x 12
  • % ACH annual cost = units x ACH% x average rent x % fee x 12 (apply cap)
  • Check annual handling cost estimate = units x check% x ($2.01 to $4) x 12

4) Platform TCO questions

  • Flat per-unit monthly platform price? $___ per unit per month
  • Are there added charges for extra bank accounts, accounting exports, additional users, or premium automation? ___
  • Is ACH "free" because the platform charges more elsewhere, or because zero ACH fees are structural to the platform's pricing? ___

Decision rule. Choose the option with the lowest all-in dollars per unit per month and the highest pricing transparency.

FAQ

Are ACH payments always cheaper than checks for rent collection?

Often yes, but it depends on your platform. NACHA has cited median ACH costs around $0.26 to $0.50, while checks can cost $2.01 to $4 when you include business issuance and handling. However, many rent portals charge $1 to $2.50 per ACH, which can erase some of ACH's natural advantage. The cheapest setup is a platform that does not charge ACH transaction fees at all, which preserves the underlying network economics rather than marking them up.

What is the difference between a flat ACH fee and a percentage ACH fee?

A flat fee charges the same amount per rent payment, for example $1 or $2.50, regardless of rent amount. Percentage pricing charges based on rent amount, for example 0.8% capped at $5. Percentage models can get expensive as rents rise, especially if the cap is frequently hit. On a $1,500 rent, a 0.8% fee capped at $5 hits the cap and costs $60 per year per unit. A flat $1.50 fee on the same rent costs $18 per year per unit.

Can I pass ACH or convenience fees to tenants?

Sometimes, but rules vary by state and must be disclosed. For example, New York restricts requiring electronic payments and prohibits fees tied to opting out. Illinois prohibits mandatory EFT provisions in leases. California allows convenience fees with a fee-free method available under SB 611. Always verify local rules with a qualified attorney and ensure your lease language and portal disclosures match. Getting this wrong creates legal exposure that can quickly outweigh whatever processing revenue you were trying to recover.

What is the simplest way to compare rent-collection platforms?

Compute total cost of ownership per unit per month. Add subscription fees, processing fees, and exception handling costs, then divide by units and months. If two platforms collect the same rent, the one with flat monthly per-unit pricing and no hidden fees is usually easier to forecast and manage, especially as your door count grows. A platform that charges zero ACH transaction fees as part of its base pricing is the simplest of all to forecast, because the processing line item is $0 and only the subscription matters.

What to Do Next

Run a one-month "fee truth" audit. Export your last 30 days of rent payments and calculate three things. Total ACH fees, total failed and returned payments, and staff time spent chasing exceptions. Then annualize it using transactions times fee times 12, and compare it against a platform built for cost clarity. Flat monthly per-unit pricing, no hidden fees, and automation (autopay, reminders, reconciliation) designed to cut manual work. If your annualized processing spend is larger than you expected, that is your signal to renegotiate or switch to a more transparent rent-collection system.

This is exactly the gap Shuk is built to close, and zero ACH transaction fees is one of the most direct ways Shuk gives landlords and property managers their margin back.

Shuk's online rent collection charges no ACH transaction fees, structurally, not as a promotional waiver. On a 200-unit portfolio collecting rent monthly through Shuk, the ACH line item is $0 per year. Compare that against the math above. Even at a relatively modest $1.50 flat ACH fee, the same portfolio would pay $3,600 per year on processing alone. At Stripe's 0.8% capped-at-$5 rate, $12,000 per year. At an uncapped percentage rate, far more. The savings compound every month, every year, across every unit.

Around rent collection, the same Shuk subscription gives you the rest of the workflow that makes rent collection actually work. Configurable late fees applied automatically, so you do not have to chase delinquencies one by one. Payment history tracked per tenant and per property, so you always know who paid and when. Payment requests for one-off charges (move-in costs, utilities, tenant-caused repairs) with attached notes and receipts. Centralized in-app messaging with email and push notifications, so payment reminders and late-fee notices stay documented. Schedule E-aligned expense organization. Payment and income reports you can filter by property, tenant, or date range and export to PDF or Excel. The Lease Indication Tool polls tenants monthly starting six months before lease end so you can intervene before turnover. Maintenance request tracking. Tenant screening through our partner. E-signature for leases through our Adobe-powered integration. And Year-Round Marketing.

At $5 per unit per month with no setup fees, and with White Glove Onboarding included at no additional cost (where the Shuk team handles property setup, account preparation, and renter onboarding for you), Shuk is built so the processing line item never quietly eats your NOI. Shuk now supports third-party management with multi-user workflows and role-based access, so an entire property management team can operate from the same zero-ACH-fee structure.

Book a demo at shukrentals.com/book-a-demo to see how Shuk's online rent collection with zero ACH transaction fees, automated late fees, payment history tracking, payment requests, centralized in-app messaging, Schedule E-aligned expense organization, exportable payment and income reports, the Lease Indication Tool, maintenance request tracking, tenant screening, e-signature, and Year-Round Marketing work together so rent collection stops being a hidden cost center.

Property Management Software
Landlord Management Software: The 7 Features That Actually Save You Time

Managing 1 to 100 Units Without a Full Back Office

Managing 1 to 100 units without a full back office means you are doing more than collecting rent. You are chasing late payments, answering the same questions, coordinating repairs, tracking receipts at tax time, and working to keep good tenants from leaving. Independent landlord surveys consistently point to the same bottlenecks: maintenance and screening sit at the top of the stress list.

Note: This article provides general education about landlord management software features, not product recommendations. Feature availability, pricing, and performance vary by platform.

The right landlord management software does not just centralize tasks. It removes the repetitive ones. Below are seven features that consistently save the most time for independent landlords and small property managers, plus how Shuk Rentals implements each one.

1) Automated Rent Collection with Zero ACH Fees

Manual rent collection is a monthly tax on your time: reminders, check pickups, bank deposits, and "Did you get my payment?" texts. Industry analysis shows manual workflows correlate with meaningfully more late payments compared to automated collection. Surveys show strong tenant preference for paying online, and ACH is the most-used electronic method among renters.

Shuk Rentals offers online rent collection with zero ACH transaction fees, removing the biggest friction point that stops tenants from switching to online payments. Many platforms charge per ACH payment, which leads to more "I will just mail a check" behavior. With Shuk, you can push autopay enrollment without asking residents to pay a convenience fee.

2) Tenant Screening with Credit/Eviction/Criminal Reports

Screening is where small landlords lose days, not because it is hard, but because it is fragmented. You are juggling identity questions, inconsistent criteria, and separate report vendors.

Shuk Rentals provides tenant screening through our partner (RentPrep/TransUnion) for credit, criminal, and eviction reports in one flow, so you are not sending applicants to three different places or manually matching PDFs to names. Faster approvals with consistent standards, and fewer "Where do I upload this?" messages.

3) Maintenance Request Tracking

Maintenance is the number one time sink because it is communication-heavy. Industry surveys cite maintenance and turnover tied to maintenance performance as a top operational challenge for rental owners.

A proper maintenance tracker turns "texts plus calls plus photos" into a single ticket with status, notes, and documentation. Shuk Rentals' maintenance request tracking lets tenants submit issues with photos, videos, documents, and notes, organizing requests in one place per unit so you are not rebuilding the story every time a tenant follows up.

4) E-Signature Through Adobe-Powered Integration

Leasing gets hectic when you are doing everything twice: drafting, printing, scanning, chasing signatures, and re-saving documents. E-signatures compress the entire lease cycle into one repeatable workflow.

Shuk Rentals' e-signature through our Adobe-powered integration lets you send lease packets, get signatures, and store them automatically with the tenant record. No missing initials, no lost addendum, no "Can you resend the signed copy?" two months later.

5) Schedule E-Aligned Expense Organization

Most landlords do not feel the pain until tax time, or until they need a lender-ready snapshot. Receipts live in email, vendor texts, and shoe boxes. Then you spend a weekend reconstructing the year.

Shuk Rentals' Schedule E-aligned expense organization with digital receipts pairs expenses to properties. Payment and income reports filterable by property, tenant, and date and exportable to PDF or Excel reduce bookkeeping time and make monthly check-ins realistic, even if you are self-managing after work.

6) Two-Way Reviews

Bad-fit tenants cost time in a hundred small ways: late payments, preventable conflicts, and excessive maintenance noise. Landlords often operate with zero memory beyond their own notes, and tenants move on with no accountability.

Shuk Rentals includes Two-Way Reviews, letting landlords document real rental behavior while also giving tenants a way to build credibility. Fewer repeated judgment calls, fewer "I wish I had known" situations, and faster confidence when deciding between similar applicants.

7) Early Lease Renewal Intelligence (Lease Indication Tool)

Renewals become a scramble when you find out too late that a tenant is leaving. That means rushed showings, compressed make-ready timelines, and vacancy you could have prevented with a simple early check-in.

Shuk's Lease Indication Tool (LIT) provides early renewal intelligence starting six months before lease end through tenant polling and predictive lease renewal insights, creating a simple renewal forecast rather than a mental guessing game. If three leases end in September and two indicate "likely renewing" in July, you focus your energy on the one at risk before it becomes a vacancy.

What This Adds Up To

The biggest time drains are rent follow-ups, maintenance coordination, leasing paperwork, and bookkeeping catch-up. Moving rent to autopay and removing ACH friction reclaims several hours on its own. Maintenance tracking reduces coordination overhead per ticket. Digital leases, clean reporting, and proactive renewals compound the savings.

Frequently Asked Questions

Which feature saves the most time for small landlords?

For most landlords, automated rent collection saves the most time because it eliminates the monthly cycle of reminders, check pickups, bank deposits, and late-payment follow-ups. The time savings compound when paired with autopay enrollment and configurable late fees.

Do I need all seven features, or can I start with a few?

You can start with the features that address your biggest pain point, but the compounding benefit comes from using them together. Rent collection plus maintenance tracking alone can reclaim significant hours each month.

How does landlord management software differ from general business tools?

General tools are not built for property-level tracking, tenant-linked transactions, lease lifecycle management, or rental-specific expense categories. Landlord software handles these by default, reducing the workarounds that consume time in generic tools.

What to Do Next

At $5 per unit per month with no setup fees, and with White Glove Onboarding included at no additional cost, Shuk makes property management feasible for landlords running 1 to 100 units.

Book a demo at shukrentals.com/book-a-demo to see all seven features in action.