What Is the 2% Rule in Rental Property?
When you self-manage a portfolio, even just a few units, the hardest part of buying a rental property is not finding listings. It is filtering dozens of maybe deals down to the few worth your time. Between listing photos, rough rent estimates, shifting interest rates, and market headlines, you can burn hours underwriting properties that were never going to cash flow.
That is why rent-to-price rules of thumb exist. They are not meant to replace real analysis. They help you triage: move quickly, rule out obvious mismatches, and focus your energy where you will get the best return. Among these quick filters, the 2% rule is the most aggressive.
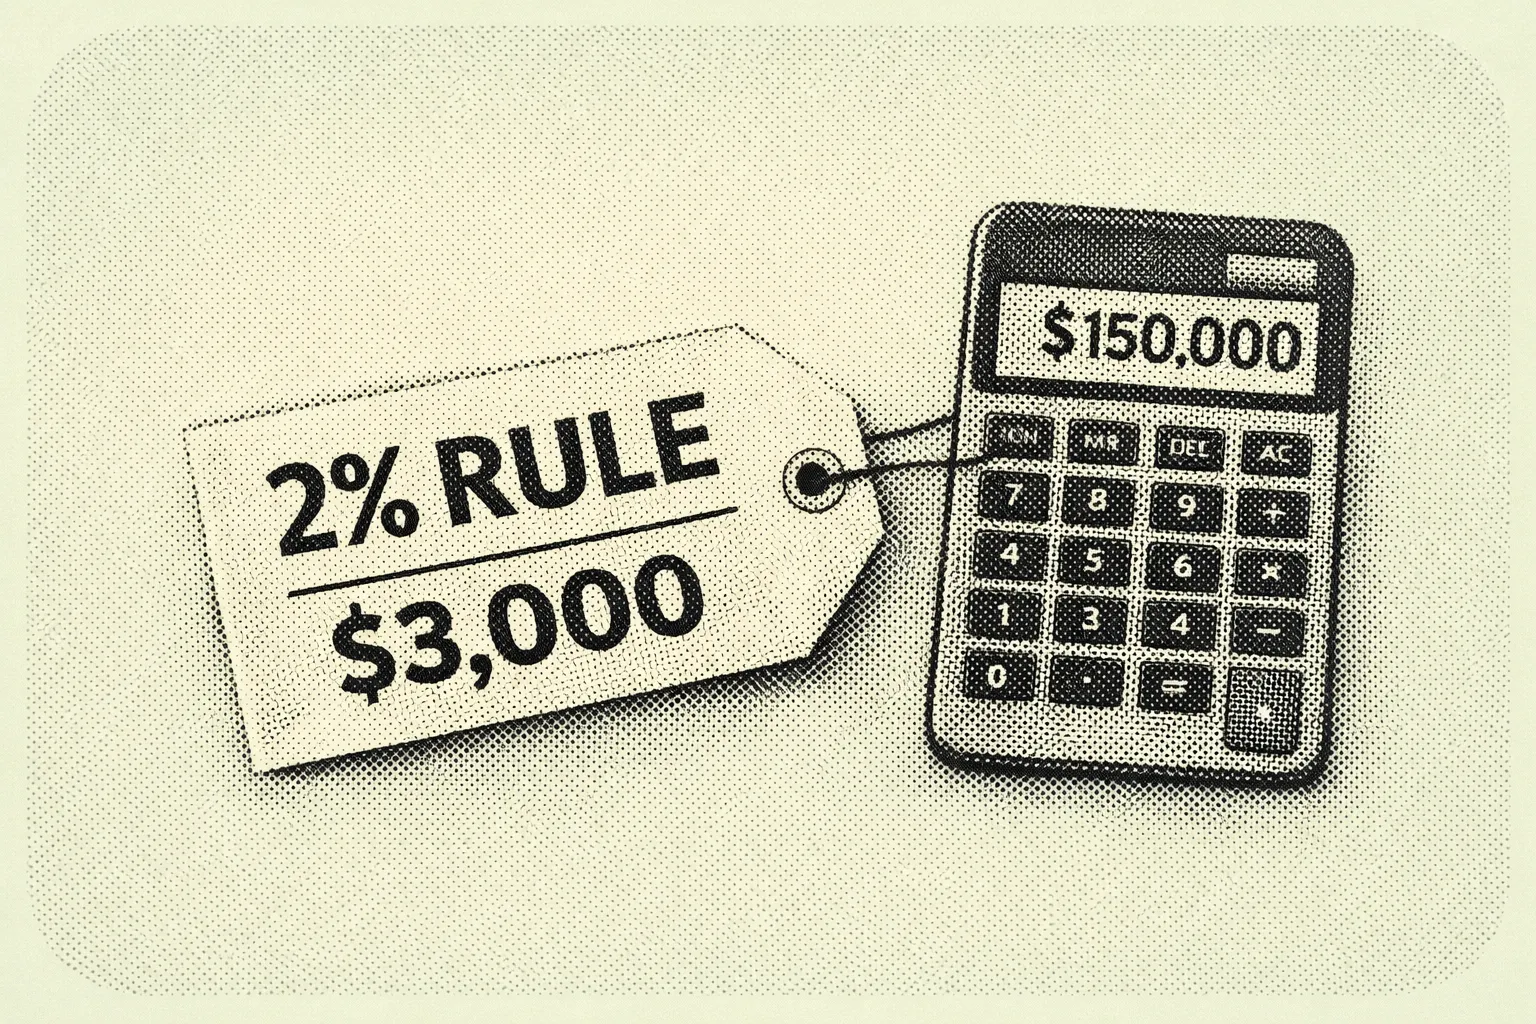
The formula is simple. A property's monthly gross rent should be at least 2% of your total acquisition cost, meaning purchase price plus rehab. If you buy for $150,000 all-in, you would want $3,000 per month in rent.
The catch is that after post-2020 home price increases, the classic 2% benchmark is now rare in many U.S. metros, especially coastal and high-growth markets. That does not make it useless. It means you need to understand when it works, where it breaks, and what to do next once a property passes or fails the screen.
What the 2% Rule Is and What It Is Not
The 2% rule is a rent-to-cost test: a quick rental income metric that compares gross monthly rent to what you invested to acquire the property. Most definitions specify total acquisition cost as purchase price plus rehab needed to get the unit rent-ready. In real-world underwriting, you will often also want to consider closing costs, initial leasing costs like paint and lock changes, and immediate safety or code items.
The higher the monthly rent is relative to what you paid, the more room you typically have to cover operating expenses including taxes, insurance, repairs, vacancies, and property management, and still produce cash flow. That is why percentage rules became popular among cash-flow investors in lower-cost Midwestern markets and why they have been widely discussed in landlord education communities since the early 2000s.
Here is what the 2% rule does not do. It does not account for local expense structures, which can vary dramatically by county and state. It does not incorporate financing terms including interest rate, down payment, or loan structure. It does not measure profitability directly because it ignores vacancy, maintenance, capital expenditures, and tenant turnover. And it does not capture appreciation expectations, which research has shown can be a major component of long-run returns.
Because of those omissions, the 2% rule is a fast smell test, not a full inspection. Use it as a starting filter, then validate the deal with expense-based metrics like cap rate, cash flow projections, and debt service coverage analysis.
How to Use the 2% Rule Without Fooling Yourself
Step 1. Start With the Exact Formula and Define Your All-In Cost Up Front
The calculation is straightforward.
Rent-to-cost ratio = Monthly gross rent divided by total acquisition cost.
A property meets the 2% rule if monthly gross rent is at least 2% of total acquisition cost.
Run the metric two ways for consistency. The core test uses purchase price plus rehab, which aligns with the most common definition. The conservative test adds estimated closing costs and initial leasing expenses, which is closer to your true cash invested. Rules of thumb are already blunt instruments. If your inputs vary deal to deal, the rule produces noise instead of signal.
Step 2. Use Current Market Anchors to Set Realistic Expectations
The biggest reason landlords get discouraged by the 2% rule is that they apply it in markets where it is structurally unlikely. Recent Zillow data illustrates why this matters.
Los Angeles shows average home values near $941,985 and average rents around $2,658, producing a rent-to-value ratio of roughly 0.28% per month. Seattle shows average home values near $848,869 and average rents around $2,258, producing roughly 0.27% per month. Indianapolis shows average home values near $223,231 and average rents around $1,463, producing roughly 0.66% per month. Cleveland shows average home values near $113,669 and average rents around $1,250, producing roughly 1.10% per month. Tampa shows average home values near $369,079 and average rents around $2,213, producing roughly 0.60% per month.
These are broad metro averages, not deal-specific comps. But they illustrate a critical point: the same 2% threshold implies dramatically different feasibility depending on local prices, rent ceilings, and supply and demand conditions.
Instead of asking whether a market meets 2%, ask what rent-to-cost ratios are typical there, and if 2% is unrealistic, what threshold reliably indicates a workable cash-flow candidate. Many modern investor discussions treat 1% or even 0.8% as more realistic in many areas, while still using 2% as a home-run screen in low-cost or distressed value-add contexts.
Step 3. Run the Calculation Step-by-Step: A Midwest Value-Add Example
A landlord finds an older house in the Cleveland area priced below the broader metro average, needing moderate rehab.
Purchase price: $95,000. Rehab to rent-ready: $15,000. Total acquisition cost: $110,000. Expected monthly gross rent: $1,950.
Dividing $1,950 by $110,000 produces a ratio of 1.77% per month. To meet the strict 2% rule, the property would need $2,200 per month in rent.
This property fails the 2% threshold, but it is close. In many real-world scenarios, a 1.7% to 1.8% ratio may still be worth full underwriting, especially if the rehab estimate is tight, tenant demand is strong, and the neighborhood risk profile fits your management capacity. Cleveland's broader metro average produces about 1.10% rent-to-value. A deal at 1.77% is significantly above that average, suggesting a favorable purchase basis, above-average achievable rent, or both. That is often what a good deal looks like in a low-cost market: you are outperforming the typical rent-to-price relationship, not chasing a mythical 2% in every zip code.
Step 4. Contrast With a High-Cost Coastal Market
A landlord evaluates a small duplex in Los Angeles with strong tenant demand but a high acquisition cost.
Purchase price: $950,000. Rehab and turnover work: $25,000. Total acquisition cost: $975,000. Expected monthly gross rent for both units combined: $5,400.
Dividing $5,400 by $975,000 produces a ratio of 0.55% per month. To meet the 2% rule, the property would need $19,500 per month in gross rent, which is far beyond typical long-term rents for most small multifamily properties in any market.
In coastal markets, investors often justify acquisitions through a different return mix: lower current yield paired with potential long-term appreciation, rent growth, tax advantages, and inflation hedging. Academic work on rent-price dynamics confirms that expected capital gains can heavily influence buying behavior even when rent ratios are low. That is precisely why simplistic ratios can mislead if treated as universal laws rather than market-relative tools.
Step 5. Compare the 2% Rule to the 1% Rule
The 1% rule is the more commonly cited version: monthly gross rent should be at least 1% of total acquisition cost. It became widely popular through mainstream landlord education and investor communities and is generally treated as a first-pass filter before deeper underwriting.
The practical difference comes down to thresholds. The 2% rule is a very high bar, often indicating a low purchase price relative to rent, significant distress or value-add, or a higher-risk area where prices are low for a reason. The 1% rule is still a strong quick screen in many markets but is challenging in most coastal metros given current pricing.
Use both as a funnel. If a deal meets 2%, treat it as a priority but scrutinize neighborhood quality, tenant demand, and deferred maintenance, because too good can mean hidden risk. If it meets 1% but not 2%, underwrite it because it may still cash flow depending on expenses and financing. If it fails 1%, do not automatically discard it in expensive markets, but require a strong alternative thesis: appreciation potential, development optionality, ADU value, or a clear repositioning plan.
Step 6. Cap Rate Versus the 2% Rule: What Each Metric Tells You
Both metrics compress a deal into a single number, but they answer different questions.
The 2% rule uses gross monthly rent and acquisition cost, ignores expenses and financing, and is best as a fast screening tool. Cap rate uses net operating income divided by purchase price, which means it reflects operating reality more accurately because it accounts for taxes, insurance, repairs, management, and other operating costs. Cap rate still ignores financing, but it captures the expense differences that the 2% rule cannot see.
Two properties can have identical gross rent and identical acquisition cost but wildly different cap rates if one sits in a high-tax county, a higher-insurance region, or a property with major capital expenditure coming due. A practical workflow for self-managing landlords: use the 2% or 1% rule to filter, then estimate a quick cap rate to sanity-check the operating story, then run full financing and cash flow projections including cash-on-cash return, debt service coverage, and stress tests.
Step 7. Add Market and Property-Type Nuances
Property taxes and insurance can break a deal that passes the 2% screen. Expense structures vary by location and are not captured in a gross-rent ratio. Never buy the ratio without validating expenses first.
Post-2020 pricing has made 2% rare in many markets. Many landlords now operate with a tiered target: 2.0% as exceptional, typically limited to value-add, distressed, or very low-cost market scenarios; 1.0% to 1.5% as the more common cash-flow hunting range in many non-coastal markets; and 0.5% to 0.9% as common in high-cost metros requiring a different investment thesis.
Property type also matters. A duplex or fourplex may produce more rent per dollar of purchase price than a comparable single-family in the same neighborhood. Some high-demand single-family neighborhoods command a rent premium, but purchase prices often outpace rents, pushing ratios down. Broad Zillow averages in Los Angeles and Seattle confirm this dynamic at the metro level.
2% Rule Quick Screen Template
Use this when scanning listings or reviewing off-market leads. Apply the same inputs and the same math consistently so you do not treat deals differently based on how much you like them.
Inputs: Purchase price. Rehab to rent-ready. Closing and initial leasing costs (optional but recommended). Projected monthly gross rent.
Calculations: Core all-in cost equals purchase price plus rehab. Core rent-to-cost ratio equals monthly rent divided by core all-in cost. Conservative all-in cost adds closing and initial costs. Conservative rent-to-cost ratio equals monthly rent divided by conservative all-in cost.
Decision rules: At 2.0% or above, flag as priority and proceed to full underwriting, but scrutinize neighborhood quality, deferred maintenance, and confirmed rent comps. Between 1.0% and 1.99%, underwrite the deal because it may be viable depending on expenses and financing. Below 1.0%, proceed only with a clear alternative thesis covering appreciation, redevelopment potential, exceptional rent growth, or a positioning plan that supports the acquisition at that price.
Next numbers to pull before making an offer: Rent comps for the same bedroom and bathroom count in similar condition. Taxes and insurance estimates using local sources rather than national averages. A rough annual expense budget covering maintenance, reserves, and vacancy. A quick cap rate calculation to compare against what the rent-to-cost ratio suggests.
Frequently Asked Questions
Is the 2% rule still realistic in 2026?
In many U.S. markets, especially high-cost coastal metros, the traditional 2% rule is rarely achievable for standard long-term rentals because prices have outpaced rent growth. Zillow's broad metro data illustrates the gap clearly: in Los Angeles, average home values near $941,985 paired with average rents around $2,658 produce a rent-to-value ratio far below 1%, let alone 2%. That said, 2% can still appear in specific situations including distressed purchases, heavy value-add rehabs, low-cost neighborhoods, and certain rental operations. Use it as a home-run screen rather than a universal expectation.
Does meeting the 2% rule guarantee positive cash flow?
No. The 2% rule is based on gross rent and acquisition cost and ignores operating expenses and financing entirely. A property can pass the screen and still cash flow poorly if taxes, insurance, maintenance, utilities, or turnover costs are high, or if financing terms are unfavorable. Treat it as the first filter, then validate the deal with expense-based metrics like cap rate and a full financing-based cash flow model.
What is the difference between the 1% rule and the 2% rule?
They are the same concept with different thresholds. The 1% rule says monthly gross rent should be at least 1% of total acquisition cost. The 2% rule uses 2% and is therefore much stricter. In today's pricing environment, many investors view 1% as challenging but sometimes workable in lower-cost markets, while 2% is often limited to unusually strong cash-flow deals or higher-risk areas.
If my market cannot hit 1% or 2%, what should I use instead?
Do not force a national rule onto a local market. In expensive metros, broad market data shows rent-to-value ratios closer to a fraction of 1% at the metro level. In those environments, shift your screening toward realistic cap rate estimates, conservative cash flow after financing, and a clearly articulated long-term thesis covering appreciation, rent growth, and repositioning potential. Percentage rent rules do not capture expected capital gains, which research confirms can be a major driver of investor returns in high-cost markets.
If you want to track rent-to-cost ratios alongside the operating metrics that actually drive long-term performance, book a demo to see how Shuk helps landlords monitor income trends, vacancy, and portfolio health from one place.

.webp)

